


Low float small cap momentum is back in the market, but do you know how to find support and resistance on your charts? Learning to identify and use these important levels will help improve your entries, exits and your overall profitability!
Today we saw some really nice momentum on $IO and $CECO. You can see my full mid-day Market Recap below where I review each of these trades in detail. But in summary, today was a day that my Gap and Go watch list let me down. None of the 4 stocks I was watching $AUPH, $FSNN $TROV $ELMD ended up giving me a good setup or a winning trade. This is a little unusual but it’s part of trading.
When I have a day that my watch list stocks don’t work out, I quickly look to my Surging Up MOMO Scanner to find the volume in the market. That’s how I found both $IO and $CECO. In both cases, I bought these right off the scanner alert with an automatic 10 cent stop. Each of these trades required a close understanding of the daily support and resistance levels.

Check out my p/l today on the names I traded. This is the Breakout of Bailout Strategy at work!
Finding Support and Resistance Levels
Finding daily and intraday support and resistance levels is critical to your success as a trader. These levels give you an understanding of safe entries, potential exit targets, and cautions you to the level of risk in any given trade. We discuss these topics extensively in our Day Trading Courses, but in brief, I want to cover some of the basic concepts. The first things I look for in a daily chart are the location of the moving averages (9ema, 20ema, 50ema and 200ema).
EMA stands for Exponential Moving Average. This tells us the average price of a stock over a period of time, and weights recent price action slightly more heavily than older price action. If I’m looking to buy a stock I don’t want to see that we are just underneath a resistance level of a moving average.
I would much prefer to see us above the moving averages, or to see that we have more than enough room until we’ll run into one of the moving averages. If we have a lot of room, I might consider the moving average to be my first profit target since it will be a form of resistance.
The next thing I look for is the high and low of recent candles in the past. When I’m looking to buy a stock to the long side, as I’m looking at the chart, I look left, and up, to find the high or low of the first candle. I continue looking left and up until I’ve marked out as many levels as I can see. If the highs and lows of candles are spaced 10-20 cents apart, I consider them small levels of resistance.
If the highs and lows are spaced 40-50 cents apart or more, I consider each of those levels to be a breakout trigger, with no real resistance until the bottom of the next level. See the images below for clarification on this.
Once I have identified the daily moving averages and recent highs and lows that form support/resistance levels, I’ll be ready to take my day trades based on the Gap and Go, Momentum, or Reversal strategies we teach in the courses.
$IO Small Cap Daily Support and Resistance Levels
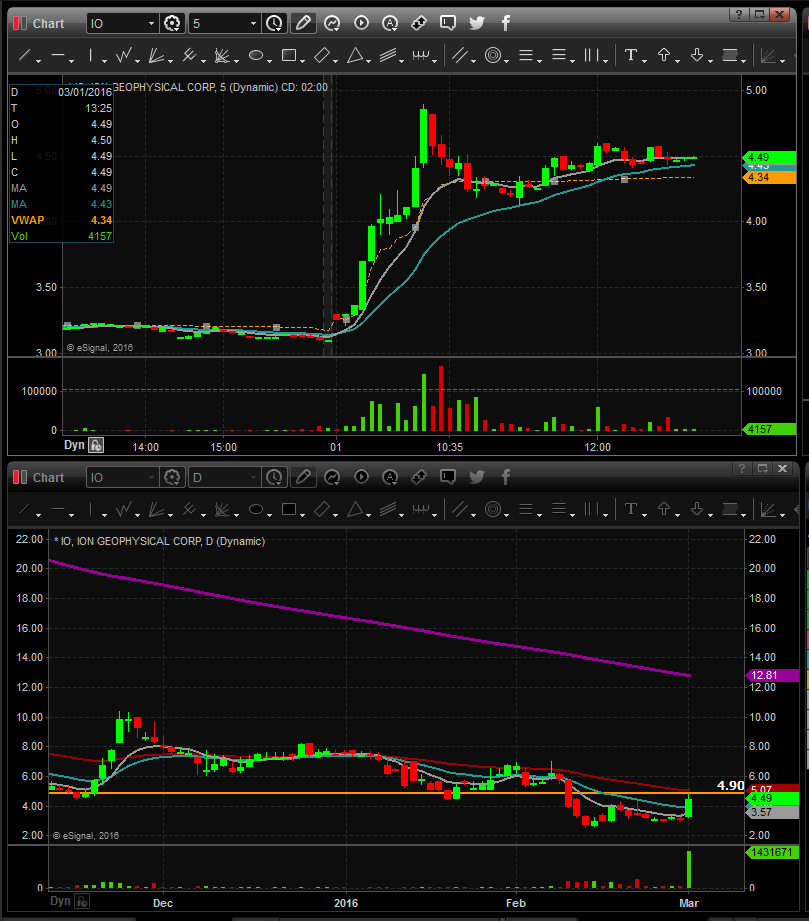
Notice how $IO approached the 50ema on the daily and then pulled back? Because we know that level is there, we can recognize we need to be cautious on any high of day (HOD) trades around that price! If that moving average hadn’t have been there, we would have had a lot more potential on this one (even more than the 50% we saw!)
Scanners I Use For Low Float Stocks

When Support and Resistance is Being Respected
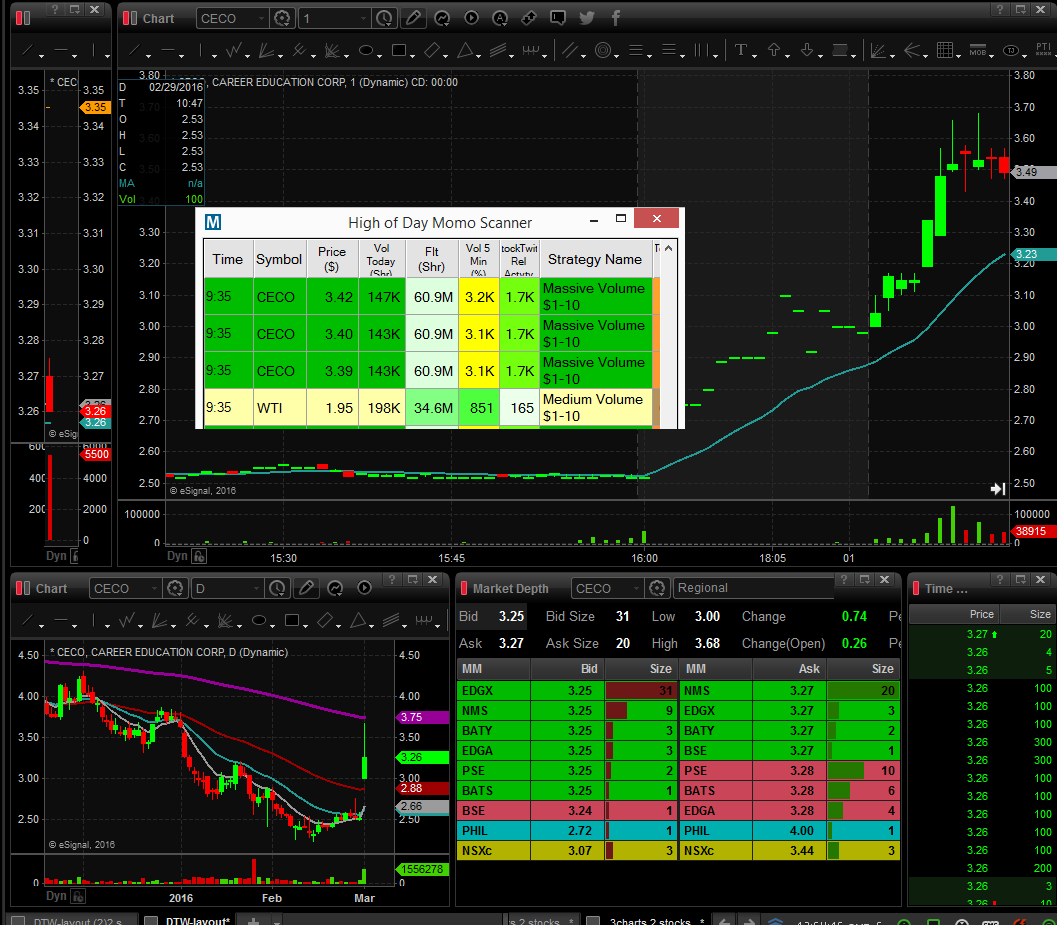
Notice how $CECO surged up and tapped the 200ema resistance line on the daily (purple). Knowing we have resistance here is what prevents us from buying at 3.70 for a hod push to 4.00.
We know we have to be more careful because of the daily chart. Make sure you study your daily charts so you can stay one step ahead!