


- Momentum Day Trading Strategy
- Day Trading Strategies & The Anatomy of Momentum Stocks
- Finding Stocks For My Day Trading Strategies
- My Favorite Momentum Day Trading Chart Patterns
- Real Life Momentum Day Trading Strategy Examples
- Risk Management 101: Where to Set My Stop
- The Best Time of Day to Trade
- Entry Checklist Summary
- Exit Indicators
- Analyze Your Trading Results
This year I’ve made well over six figures in fully verified profits with my Momentum Day Trading Strategies. Best of all, I’ve made these profits trading just 2hrs/day. I’m going to teach you the STEP BY STEP guide for how to understand these day trading strategies.
Lets start by answering a simple question. What is day trading? Day Trading is the simple act of buying stocks with the intention of selling them for a higher price (Short selling traders sell stocks with the intention of covering at a lower price to make a profit).
Sadly, most beginning day traders will lose money. Trading involves a high amount of risk and can cause beginner traders to quickly lose tens of thousands of dollars. However, the allure of day trading is the fact that skilled traders can make six figures working only 2-3 hours a day.
Most aspiring traders are seeking financial freedom & security, and independence. In order to be a successful trader you must adopt a trading strategy. My favorite is called Momentum Trading Strategy. That’s what I’m sharing with you here today.
Momentum Day Trading Strategy
Momentum is what day trading is all about. One of the first things I learned as a beginner trader is that the only way to profit is by finding stocks that are moving. The good news is that almost every single day there is a stock that will move 20-30% or even more! This is a fact.
The question is how do we find those stocks before they make the big move. The biggest realization I made that has led to my success is that the stocks that make the 20-30% moves all share a few technical indicators in common.

Before going any further, let’s step back for a moment and ask ourselves what we require from a momentum day trading strategy. First of all, we need a stock that is moving. Stocks that are chopping around sideways are useless.
So the first step for a trader is to find the stocks that are moving. I use stock scanners to find these. I ONLY trade stocks at extremes. This means I look for a stock having a once in a year type of event. The price action associated with this event is almost always the cleanest.
Day Trading Strategies & The Anatomy of Momentum Stocks
Momentum stocks all have a few things in common. If we scan 5000 stocks asking for only the following criteria to be true, we’ll often have a list of less than 10 stocks each day. These are the stocks that have the potential to move 20-30%. These are the stocks I trade to make a living as a trader.
Criteria #1: Float of under 100mil shares
Criteria #2: Strong Daily Charts (above the Moving Averages and with no nearby resistance).
Criteria #3: High Relative Volume of at least 2x above average. (This compares the current volume for today to the average volume for this time of day. These all refer to the standard volume numbers, which are reset every night at midnight.)
Criteria #4: A fundamental catalyst such as a PR, Earnings, FDA Announcement, Activist Investors or some other kind of breaking news. Stocks can also experience momentum without a fundamental catalyst. When this happens, it’s called a technical breakout.
Finding Stocks For My Day Trading Strategies
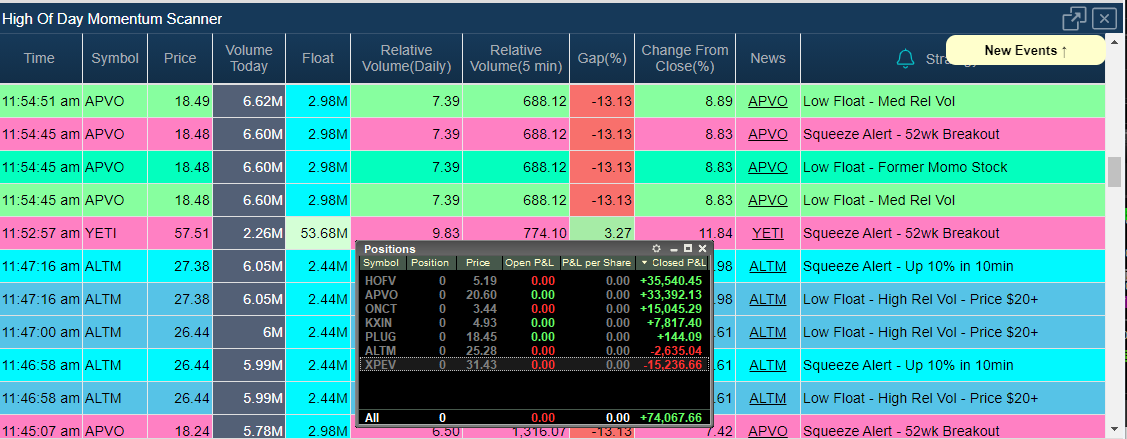
Stocks Scanners allow me to scan the entire market for the types of stocks displaying my criteria for having momentum.
These scanners are the most valuable tools for a day trader, and I had my development team build them right into our Chat Room software. Once the scanners give me an alert, I then review the candlestick chart and try to get an entry on the first pull back.
Most traders will buy in this same spot, those buyers create a spike in volume and result in a quick price change as the stock moves up. Your job as a beginner trader is to learn to find the entry in real-time.
I have created 3 sets of stock scanners for 3 different types of scanning. I have my Momentum Day Trading Strategies scanners, my Reversal Trading Strategies Scanners, and my Pre-Market Gapper Scanners.
These 3 scanners give me tons of trade alerts everyday. Instead of having to manually flip through charts, I can instantly see stocks that are in play. Stock scanners are what every trader today should be using to find hot stocks, whether it’s penny stocks, small caps, or large caps.
My Favorite Momentum Day Trading Chart Patterns
Bull Flags are my absolute favorite charting pattern, in fact I like them so much I made an entire page dedicated to the Bull Flag Pattern. This pattern is something we see almost every single day in the market, and it offers low risk entries in strong stocks.
The hard part for many beginner traders is finding these patterns in real-time. These stocks are easy to find using the proprietary stock scanners I have developed and use everyday in our chat rooms.

My Surging Up scanners immediately shows me where the highest relative volume in the market is. I simply review scanners alerts to identify the strong stocks at any given time of the day.
As a pattern based trader, I look for patterns that support continued momentum. Scanners alone cannot find patterns on charts. This is where the trader must use their skill to justify each trade.
Momentum Day Trading Strategies Pattern #1: Bull Flags
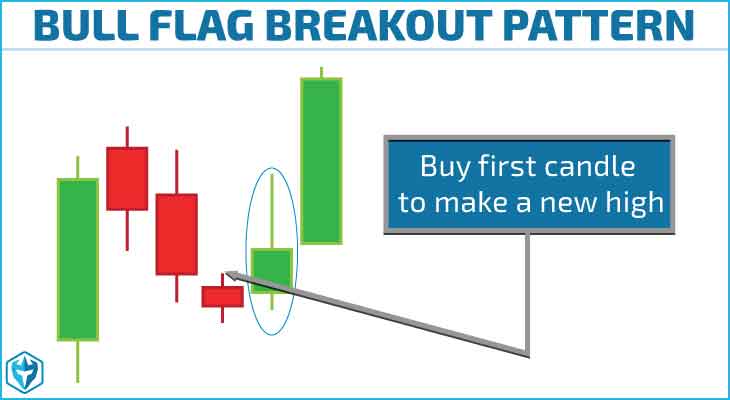 With the Bull Flag Pattern, my entry is the first candle to make a new high after the breakout. So we can scan for the stocks squeezing up, forming the tall green candles of the Bull Flag, then wait for 2-3 red candles to form a pullback.
The first green candle to make a new high after the pullback is my entry, with my stop at the low of the pullback. Typically we’ll see volume spike at the moment the first candle makes a new high. That is the tens of thousands of retail traders taking positions and sending their buying orders.
Momentum Day Trading Strategies Pattern #2: Flat Top Breakout
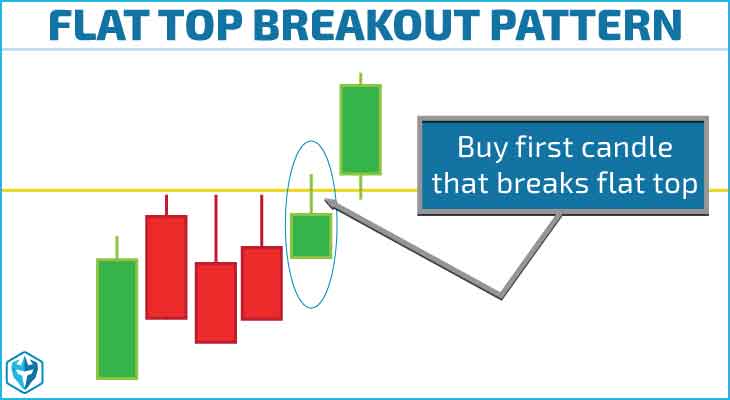 The flat top breakout pattern is similar to the bull flag pattern except the pullback typically has, as the name implies, a flat top where there is a strong level of resistance. This usually happens over a period of a few candles and will be easy to recognize on a chart by the obvious flat top pattern.
This pattern usually forms because there is a big seller or sellers at a specific price level which will require buyers to buy up all the shares before prices can continuing higher. This type of pattern can result in a explosive breakout because when short sellers notice this resistance level forming they will put a stop order just above it.
When buyers take the resistance level out, all the buy stop orders will then be triggered causing the stock to shoot up very quickly and the longs will be sitting on some nice profits when it does!
Real Life Momentum Day Trading Strategy Examples

Above is an example of a bull flag breakout. You can see we had a nice opening drive on high relative volume followed up by a consolidation period on low volume that eventually broke out again. These patterns happen everyday so knowing how to trade them is key to making money!

This is another bull flag pattern that worked out perfectly and as you can see it had the same characteristics as the other bull flag pattern above. We had a nice opening drive with decent volume followed by a low volume pullback before a big jump on the breakout.
Risk Management 101: Where to Set My Stop
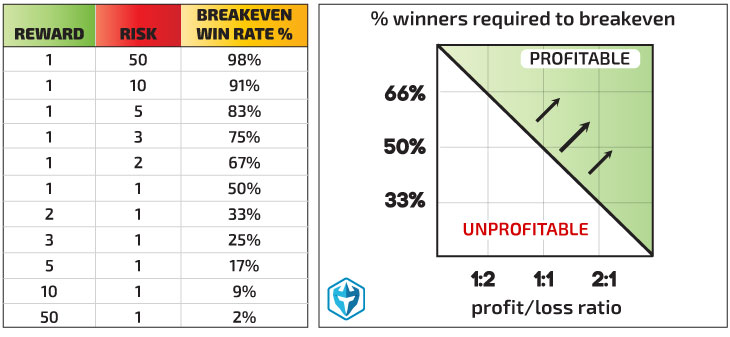
When I buy momentum stocks I usually set a tight stop order just below the first pull back. If the stop is further than 20 cents away, I may decide to stop out minus 20 cents and come back for a second try. The reason I use a 20 cent stop is because I always want to trade with a 2:1 profit loss ratio. In other words, if I risk 20 cents, it’s because I have the potential to make 40 cents.
If I risk 50 cents or more, it means I need to make 1.00 or more to get the proper profit loss ratio to justify the trade. I try to avoid trades where I have to generate a large profit to justify the trade. It’s much easier to achieve success if I have a 20 cent stop and 40 cent target vs a 1.00 stop and a 2.00 profit target.
When I’m trading I try to balance my risk across all trades. The best way to calculate risk is to look at the distance from my entry price to my stop. If I have a 20 cent stop and want to keep my max risk to $500 I’ll take 2500 shares (2500 x .20 = 500)
The Best Time of Day to Trade
The Momentum Trading Strategies can be used from 9:30-4pm but I find the mornings are almost always the best time to trade, specifically the first hour the market is open. I focus my trading from 9:30am – 11:30am. However, at any time during the day we can get a news spike that will suddenly bring a tremendous amount of volume into a stock.
This stock which was of no interest earlier in the day is now a good candidate to trade on the first pull back. The first pull back will typically take the form of a bull flag. After 11:30am I prefer to only trade off the 5-min chart. The 1-min chart becomes too choppy in the mid-day and afternoon trading hours.
Entry Checklist Summary
Entry Criteria #1: Momentum Day Trading Chart Pattern (Bull Flag or Flat Top Breakout)
Entry Criteria #2: You have a tight stop that supports a 2:1 profit loss ratio
Entry Criteria #3: You have high relative volume (2x or higher) and ideally associated with a catalyst. Heavier volume means more people are watching.
Entry Criteria #4: Low Float is preferred. I look for under 100mil shares, but under 20million shares is ideal. You can find the outstanding float with Trade Ideas or eSignal.
Exit Indicators
Exit Indicator #1: I will sell 1/2 when I hit my first profit target. If I’m risking $100 to make $200, once I’m up $200 I’ll sell 1/2. I then adjust my stop to my entry price on the balance of my position
Exit Indicator #2: If I haven’t already sold 1/2, the first candle to close red is an exit indicator. If I’ve already sold 1/2, I’ll hold through red candles as long as my breakeven stop doesn’t hit.
Exit Indicator #3: Extension bar forces me to begin locking in my profits before the inevitable reversal begins. An extension bar is a candle that spikes up and instantly put me up $2-400 or even more. When I’m lucky enough to have a stock spike up while I’m holding, I sell into the spike.
Analyze Your Trading Results
All successful traders will have positive trading metrics. Trading is a career of statistics. You either have statistics that generate returns or losses. When I work with students I review their profit loss ratios (average winners vs average losers), and their percentage of success.
This will tell me if they have the potential to be profitable, without even looking at their total P/L. Once you finish each week you have to analyze your results to understand your current trading metrics.
The best traders keep meticulous trading records because they know they’ll be able to data mine these records in order to understand what they should to to improve their trading. I use Tradervue to monitor my trading stats which has been a huge help in fine tuning my strategies.
Want to Keep Learning? I Teach ALL my Momentum Day Trading Strategies in our Day Trade Courses
In our Day Trading & Swing Trading Courses you will learn all the details of this trading strategy. In our Day Trading Chat Room, you be able to hear me while I’m trading. When I see a stock that has extremely high volume I look to get in on the first or second pull back. Pull backs should take the form of a Breakout Chart Pattern such as Bull Flags or Flat Tops.

I am an extremely active trader in the first 2 hours of the market and then I slow way down. I usually don’t trade in the afternoons. Stocks on the Surging up Scanners that are candidates for the Momentum Trading Strategy can be traded as early as 9:31.
Sometimes a stock that wasn’t gapping up and already on my radar for a Gap and Go! Strategy trade will surge with volume out of the gates and come into play for a Momentum Trade. These stocks may have news or may be experiencing a technical breakout or be a sympathy play to another strong stock or sector.