


Time and sales (AKA the tape) is a tool that shows every trade that has been executed along with the size and time for that trade. In the image below you will see that there are green and red prints along with white prints, time of trade and the size on the right.
The green prints means there are trades executing on the ask, the red means trades are executing at the bid and white prints show that trades went off in between the bid and ask. This is a very important tool for active traders and is something I use everyday, but learning how to use it properly isn’t easy to do and will require some practice.
You can see how many shares are being executed at what price and you can also see whether traders are being aggressive or not. For instance, in the time and sales window below I have it set to show orders that are being executed at the bid and ask as well as orders that are being placed above and below the bid and ask.
You will also notice that there are two different shades of red. The dark red represents orders being sold on the bid while the light red shows a sell order that was placed below the bid meaning this trader wanted to get out asap.
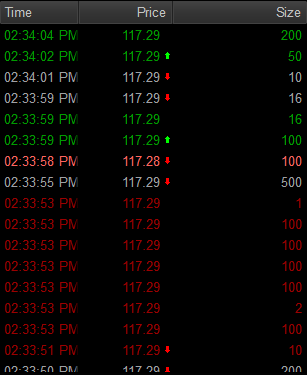
I also have it set with a lighter green color to show buyers who are aggressively getting in. This is important information as it gives you clues to what other traders are doing and at what prices.
Along with the color and size of trades, you’ll want to watch for the speed of the tape. When you are getting into a big resistance or support level there will be a lot more traders looking to get in and out which will increase the amount of trades getting executed. This is important for confirming important levels.
Warrior Trading Pro Tip – Time and Sales
Not everyone knows how to use time and sales correctly but once you understand how to read trades, it will help you with entry and exit points and understanding where important trading levels are. What I like to use time and sales for is when prices in a stock are coming into an important pivot level.
Usually you will see a steady stream of trades going off but when you get to that level you should see the tape pick up speed as more trades execute and the size of the trades getting bigger.
This is your cue and confirmation that this is an important level and that there is a high probability that prices are going to reverse or get a bounce off of it. It takes some practice to get use to but is worth the time and effort.