

Updated: October 22, 2023. Written by Ross Cameron
What is a Bull Flag Pattern?
A bull flag pattern is a bullish chart pattern that occurs when a stock is in a strong uptrend. It is called a flag pattern because when you see it on a chart the large green candle of the initial move looks like a flag pole, and the sideways consolidation near the highs looks like a flag or a pennant. The inverse of a bull flag is a bear flag.
For visual learners, check out this episode I uploaded to the Warrior Trading YouTube Channel. I discuss everything written in this article and include similar examples of the bull flag pattern. This episode was part of a mini-series on technical analysis I produced in 2022. For those who prefer to read, continue on!
What Does a Bull Flag Look Like?
I was recently checking my day trading metrics and noticed that I’ve taken over 24,268 day trades. One of the first chart patterns I mastered was the bull flag pattern, and all these years later, it’s still one of my favorites. Currently, I’m trading with an accuracy of 69%.
The reason I love trading the bull flag pattern is because it’s one of the most easily recognized chart patterns and it’s easy to find in real-time using stock scanners. But more on scanners in a moment. Let me begin by showing you what a bull flag looks like. Time for the whiteboard!

The Anatomy of a Bull Flag Pattern
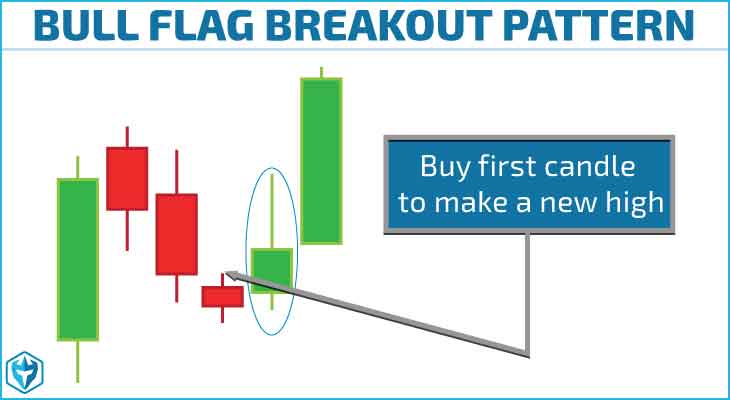
The bull flag pattern is easily recognized by the large green candles that form a flag pole. The flag pole is formed by at least one, but sometimes several large green candles. This pattern can occur on any time frame but I primarily trade it on 5-minute and 1-minute stock charts.
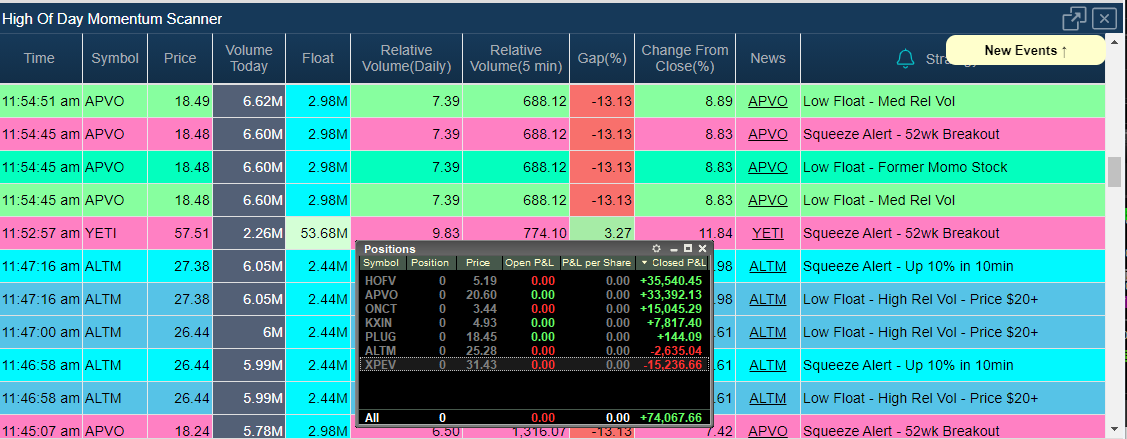
As the stock is initially squeezing higher in price it will be hitting my High of Day Momentum Scanners. This will bring the stock to my attention. I’ll watch it as it moves higher but patiently wait until the flag pattern has formed before I take my entry.
The flag portion of the bull flag pattern is formed as the stock begins to pull back. The pullback is formed by profit-taking from traders who were in before the big green candles formed and from short sellers establishing positions on an extended chart pattern for a reversal.
A bull flag pattern, or a bullish pennant pattern, typically has the following features:
- The stock has made a strong move up on high relative volume, forming the flagpole
- The stock consolidates near the top of the pole on lighter volume, forming the bull flag or bullish pennant pattern
- The stock breaks out of our of the bull flag pattern on high relative volume to continue the trend to the upside
Warning signs of a bull flag pattern that is likely to fail
- I consider it a sign of weakness if the stock retraces more than 50% of the initial move.
- If the volume during the consolidation is higher than the initial move up it indicates selling pressure.
- If the stock breaks the 9-period Exponential Moving Average or the Volume Weighted Average Price (VWAP) it’s considered a sign of weakness.
Bull flags are a chart pattern I use extensively in my momentum day trading strategy. While I primarily day trade the bull flag pattern on 1-minute and 5-minute charts, I occasionally take scalp trades using the 10-second and 1-minute charts. With my scalp trading strategy, I’m trading “micro pullbacks” using mini bull flag patterns.
For swing traders and active investors, it’s good to know that bull flags are also perfectly valid on the daily time frame. The only thing I would caution is that if the company has an upcoming news event, such as a quarterly or annual earnings report, the price action following the news release will easily override a bull flag that may be forming.
The longer you plan to hold a stock, the more you need to incorporate fundamental analysis in your trading. Most day traders rely almost entirely on technical analysis since we’re profiting from intraday fluctuations in price based on breaking news from the same day.
Example of a Bull Flag Pattern


When to Buy a Bull Flag Pattern
The main thing to look for in this pattern is volume. Volume confirms interest among retail traders and even institutional investors. The volume is what creates the breakout.
The other thing you must look for in a bull flag is a defined descending candle stick pattern that typically takes the form of 2-3 red candles. If the pullback goes to 4 or 5 candles, I’ll begin to feel concerned that buyers aren’t stepping in.
As soon as the 1st red candle has formed, I can begin looking for the first candle to make a new high. In the bull flag pattern you can see above, we had 3 red candles in a row, with the final one showing a bottoming tail. This is a reversal indicator.
What follows is a green candle that made a new high. The correct entry is the moment the green candle broke the high of the red candle. Sometimes, I will take a starter position just before this price for a better cost basis. This is called anticipating a breakout. In these cases, I then add as it breaks through this apex point in the pattern.
Entry Checklist for a Bull Flag Pattern
- Stock is moving higher in price on high relative volume (large green volume bars), preferably from a breaking news catalyst.
- The price consolidates at or near highs with a defined pullback pattern.
- A pullback should not retrace more than 50% of the move up, and should not break below the Volume Weighted Average Price (VWAP)
- The correct entry is the first candle to make a new high after 2-3 red candles of pulling back. By placing my mouse over the previous red candle I can see the high, low, open, and close prices of that period. The moment a green candle breaks the high is when I’m a buying.
- The max loss or stop is at the low of the pullback
- I need a 2:1 profit vs loss ratio

When to Sell a Bull Flag Pattern
Bull flag patterns have a statistical edge if traded correctly but in the event the setup fails you need to know where to get out. Or more definitively, the point on the chart where you know this setup is no longer valid and it’s time to jump ship.
There are a couple of different ways to manage this trade. The most common is to place a stop loss at the bottom of the consolidation area. This is where you know that the setup is no longer working out and it’s time to take a loss and move on. I also follow the principle of “breakout or bailout”. If a stock doesn’t immediately move higher after my entry, I exit. After all, my test traders work right away. So if the trade isn’t working, I may have timed it wrong, or it may simply be one of the times the pattern fails.
Given my accuracy is about 69% on over 24,000 trades, I’m still wrong 31% of the time. Losses happen. The biggest winners in day trading are those who can cut their losses quickly and move on to the next trade.
When to Take Exit a Trade in a Bull Flag Pattern
- Based on the 2:1 profit-to-loss Ratio, the correct place to consider taking profit is when the stock is approaching the first profit that justifies the trade, OR if you see one of the exit indicators below tell me to sell immediately.
- I scale out by selling 1/2, then selling a little more, so I can hold until I finally get an exit indicator.
- I see heavy resistance on the level 2 in the form of a big seller, I bail out by selling on the bid.
- I stop seeing buying, and I’m just seeing a lot of selling on the time & sales, I bail out by selling on the bid.
- If my first profit target has touched, I sell half by selling on the ask , and adjust stop to breakeven for remainder.
- If 2nd or 3rd profit targets are hit, I continue to sell small pieces on the ask.
- If my entry is on the 5min chart, typically I will sell on the first red candle on the 5min chart, unless I’m already up so much that I can afford to hold through the pullback.
- Since I expect an immediate breakout, if we don’t get it, I’ll get out at breakeven.
How to Find Bull Flag Patterns
Bull flag trading is relatively simple, but the most challenging part of trading this pattern is finding it in real-time. I use stock scanners to help me find stocks moving up quickly, then I watch these stocks as they begin to pull back and form a bull flag pattern. Because these scanners utilize real-time market data they are not free. However, they are the tools I use daily in my own trading and I encourage active traders to use the same, or something similar. If you’re looking for free scanners to find bull flag patterns you can check out Finviz, however, this is only good for daily charts, not real-time intraday scanning.
The Bull Flag Pattern vs the Bear Flag Pattern
A bear flag pattern is identical to a bull flag pattern except the trend will be to the downside. You’ll have a sharp down move on high relative volume followed by a slight replacement back up towards the 9 exponential moving average before continuing on the trend. Short sellers will use this pattern to establish short positions, where they can profit as a stock declines in value.

The key to trading flag patterns is following the volume. When volume comes in on the breakout, you want to be jumping on board because this is confirmation that other traders were waiting for the same thing and will increase the likelihood of success dramatically.
When Do Bull Flag Patterns Fail?
The bull flag pattern will truly only work well when you’re focusing on the best stocks to day trade. If you try to trade a bull flag pattern on a stock with low relative volume or that isn’t obvious to other traders, you’ll find an inconsistent resolution.
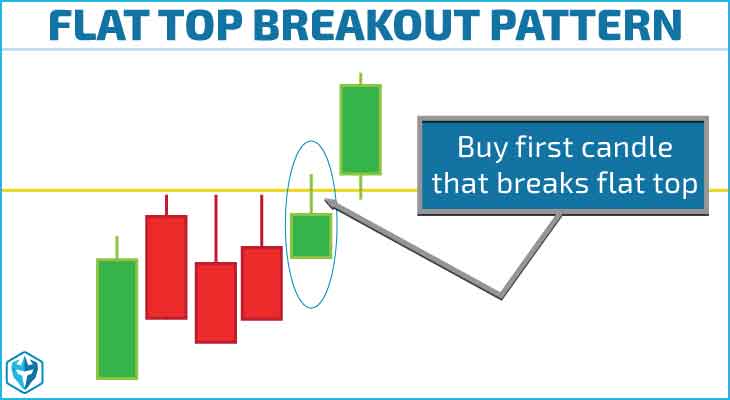
The Bull Flag Pattern vs the Flat Top Breakout Pattern
The most significant difference between a bull flag pattern and a flat top breakout pattern is that in the flat top pattern, the consolidation occurs just below the high. It doesn’t pull back in a meaningful way.
So while a bull flag experiences 2-3 red candles that can pull back to the 9-period exponential moving average, the flat top breakout consolidates within a few cents of the highs.
Here is a challenge with flat top breakouts: the entry is at the high of day. It’s a more extended entry compared with a bull flag.
I may still be able to set my max loss at the low of the pattern, but if the stock cannot hold the breakout level, I typically exit the trade immediately.
Final Thoughts
Bull flag patterns are an excellent setup for new traders to learn because they are easy to spot and trade once you understand their mechanics. When I was learning to trade, I printed out tons of examples of bull flags and posted them around my trading station. That way anytime a pattern began forming, I could refer back to an example, and confirm what I saw.
Being a profitable day trader requires you to develop the skill of pattern recognition. When I first got started I would hesitate because I didn’t have confidence. I was afraid of losing. Fear of loss was holding me back. How does a beginner day trader build confidence? Study your charts, print out tons of examples, and trade with smaller share size.
And remember, what’s even more critical than the chart pattern is ensuring you are trading the best stocks each day. It’s better to trade sub-par patterns on the best stocks than perfect patterns on the wrong stocks.