


eSignal Review
-
Value For Investors
-
Value For Active Investors
-
Fees
-
Customer Service
-
Mobile Trading
Summary
eSignal offers the best charting platform for professional traders. At $170/mo it may not be a good option for beginner traders who are on a tight budget. For beginner traders, TC2000 is likely a most cost effective platform.
Exclusive to Warrior Trading Students!
Today we’re going to review eSignal.
I’ve been actively using eSignal as my primary charting platform for over 3 years.
TC2000 was my charting platform prior to eSignal, but I felt it was too laggy, unreliable, and crashed too often at critical moments.
When I first made the switch I was immediately pleased with how fast, responsive, and stable the platform is. I currently use eSignal charts on 6 monitors while running our Day Trading Chat Room, broadcasting streaming audio/video, and running several other applications. Impressively, I’ve had zero issues with lag or crashing.
What is eSignal?
eSignal is an advanced charting platform primarily targeted at active traders who apply technical analysis.
The platform is lauded for their endlessly customizable charts and advanced analytical tools including a bulletproof stock scanner, automated systems, market profile, advanced volume analysis, and so on.
eSignal is owned by Intercontinental Exchange, the same company that operates the New York Stock Exchange and ICE futures exchanges, so you can be assured that their data quality is top notch.
In addition to being a comprehensive charting platform, featuring hundreds of technical indicators, eSignal is also a trading platform. You can connect to 50+ different brokers and execute trades directly from inside the platform.
For traders who like to have everything in 1 place, this is a huge advantage. I personally have never used this feature. Since I spent a lot of time programming my hotkeys inside my broker settings, I’m happy to continue using my broker application for trades.
The main drawback to my preference is that I have to enter symbols twice, once in eSignal and once in Speedtrader, but I don’t mind that much.
eSignal Pricing: Subscriptions & Fees
- Classic: $54/month
- Signature: $176/month (increasing to $187/month in 2021)
- Elite: $359/month
A 10% discount is offered for all plans if you prepay for the year’s membership. Keep in mind this does NOT include real-time exchange fees which can run $10 per month for the NYSE, American and Nasdaq exchanges.
eSignal has three membership tiers: Classic, Signature, and Elite. The classic tier seems like a bargain at just $52/month, but the quotes are delayed by 15 minutes, making it all but useful for active traders.
As a day trader checking out eSignal, your choices are between Signature and Elite. They’re surprisingly quite similar in their offerings given their price difference. The primary difference between the two is that Elite offers lots of proprietary technical analytics like Make-or-Break and XTL Breakout/Breakdown, as well as extra education and mentoring. The majority of day traders will get along fine with the Signature plan.
*eSignal has partnered with Warrior Trading and is offering 25% off their charting software, you can find more information on the packages and pricing here.*
Also, keep in mind that
Options, Futures, Forex, AND Stocks
I’m sure that I’m only benefiting from a fraction of eSignal’s true potential. They offer options, Forex, Futures, and Stock trading, all inside 1 platform. They also feature dozens of predefined layouts for reviewing overall market conditions. One of my favorites is called “Sector City”.
In Sector City you can review each sector leading or lagging in the market, and then sort stocks in each sector for leaders and losers. For this reason, eSignal is a popular platform among institutional traders who like to have their eyes on the big picture.
eSignal Charts
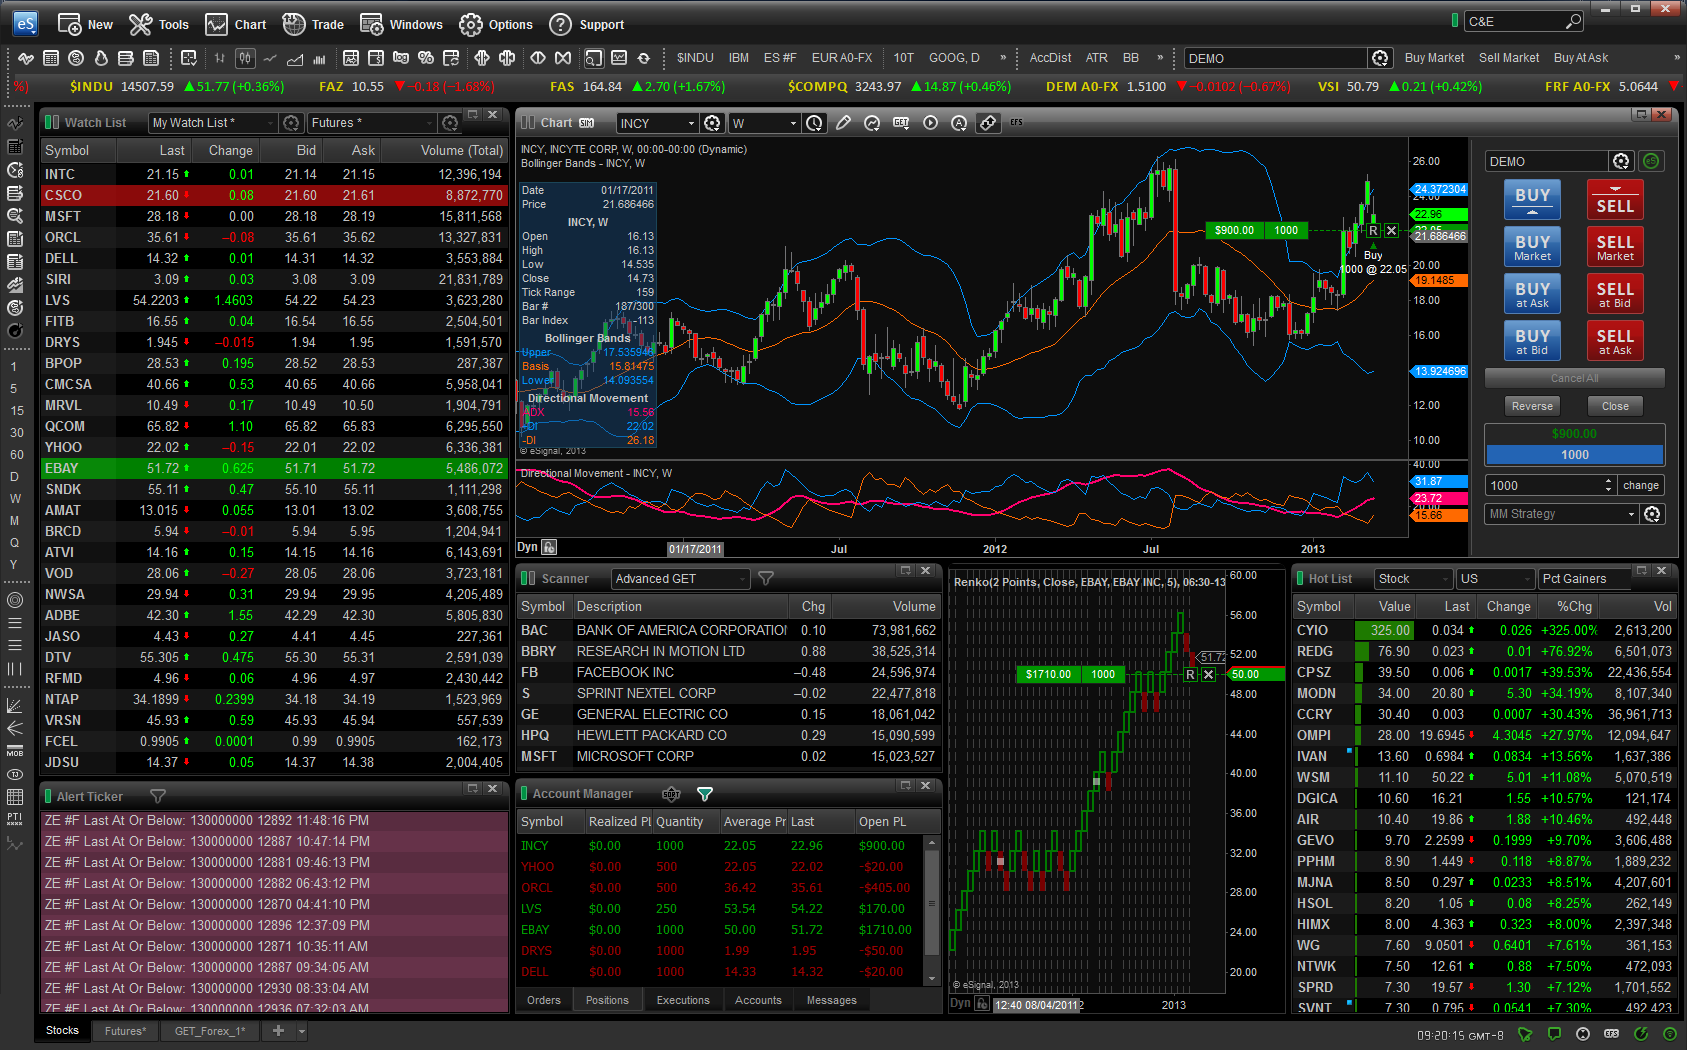
eSignal offers a wide variety of charting intervals, from time frames, to range, to volume. Here’s the list:
- Time (seconds, minutes, days, years, etc.)
- Volume (each bar represents X amount of shares traded)
- Range (each bar represents a certain price range move)
- Tick (each bar represents a certain amount of trades executed)
Chart Types
They also have plenty of charting options outside of the traditional candlestick and bar charts:
- Heiken Ashi
- Bar
- Candle
- Point & Figure
- Histogram
- Line
- Area
- Kagi
- Renko
- Price Break
What I Like
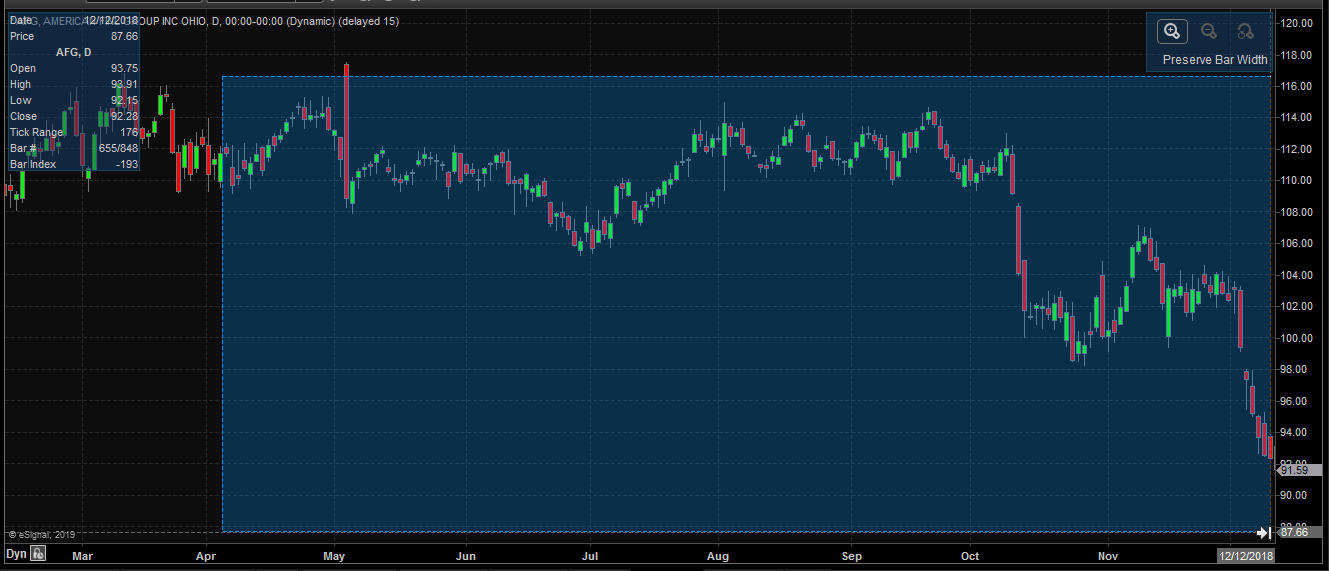
Variable Bar Sizes
When you hold shift while scrolling on the mouse bar you can change the size of the bars easily. It doesn’t have a ton of utility, but its just a neat feature that displays how endlessly customizable this platform is.
Drawing Tools
Traders who are willing to pay a premium price for a charting platform like eSignal tend to be the diligent traders who perform rigorous analysis. And these traders generally love to mark up their charts with trendlines, support and resistance zones, price channels, and other markings.
I’ve never seen a charting platform with a deeper toolbox of drawing tools. Just take a look at the drawing tools toolbar in the screenshot below. There’s still three more tools not displayed:
![]()
Charting Spreads
eSignal lets you create custom baskets of securities and weigh them differently. You’re essentially able to simulate any portfolio and chart it’s performance.
For example, I created a portfolio that is equally weighted between long SPY and short four of the market’s favorite shorts: Tesla, Snapchat, Square, and GameStop. Here is what the performance of that portfolio looks like:
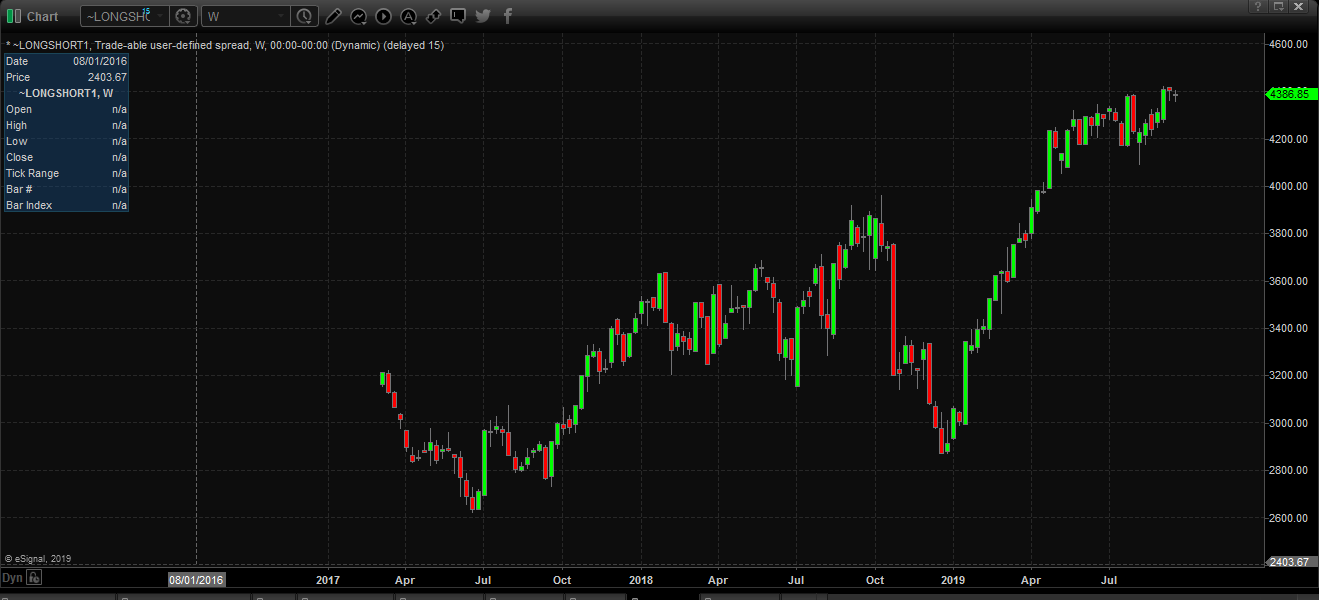
As you can see, I was able to create a custom symbol for this portfolio too, I called it “~LONGSHORT1.” This makes it easy to revisit this at any time by typing that symbol into the ticker box.
You can also create spreads to chart the difference in performance between two securities. Let’s say I wanted to see the difference in performance between J.P. Morgan and Goldman Sachs, I would type in JPM – GS in the symbol box. Here’s what that looks like charted:
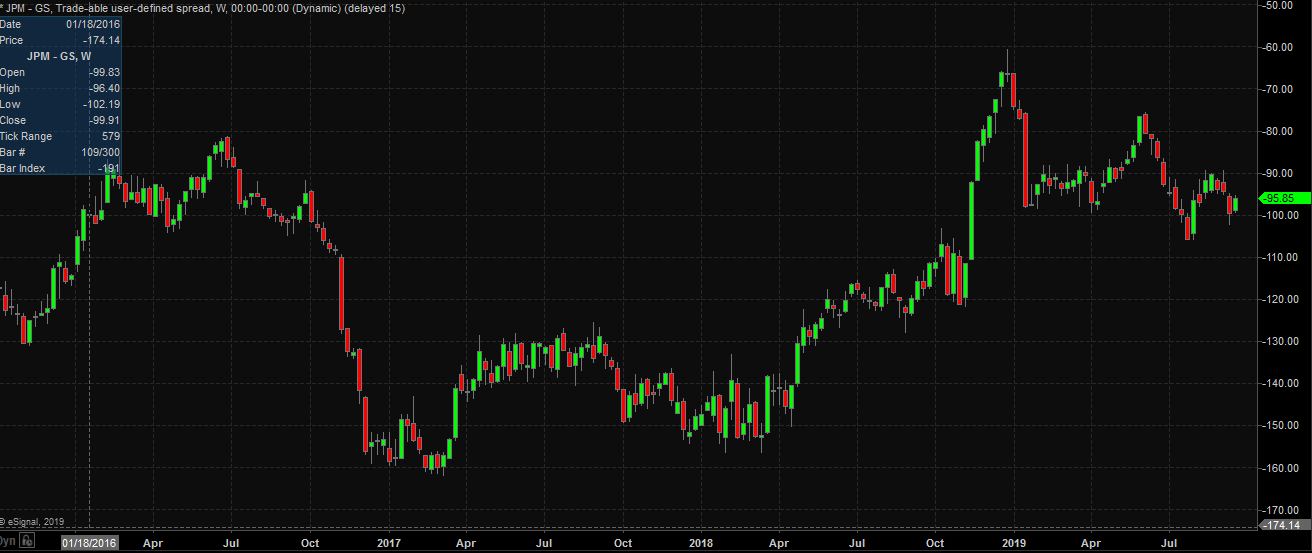
eSignal’s spread charting capabilities go even further than that, you can multiply and divide the performance of different securities, and more.
What I Don’t Like
Chart Zoom
My least favorite part of eSignal’s charts is their zoom feature. There isn’t a default keyboard macro to zoom, and you have to use a zoom mouse cursor to select the area that you want to zoom into.
I much prefer TradingView’s zoom controls. You use left-click to scroll horizontally, and the mouse wheel to zoom in and out.
eSignal Screener
eSignal’s built-in stock scanner is called Market Screener Plus, it’s lightweight and is pretty powerful. My favorite aspect of the screener is that you can create your own rules, similar to an advanced standalone screener like Portfolio123.
Let’s take an example from MarketScreener’s presets: 4 Day Loss, it looks for stocks that have closed below their previous day’s close for four days in a row.
We can see the custom rules established, each rule necessitating that the previous day’s close must be above the present day’s close. When you contrast this to a more static screener like TradingView’s, you can how much freedom MarketScreener Plus gives you.

TradingView’s screener gives you a set of filters and a way to interact with each one. When it comes to making filters interact with each other, like we do with the previous day’s closes in the example above, are very limited.
How To Install The Warrior Trading Layout
eSignal Competitors
eSignal’s primary competitors are TC2000 and TradingView.
The choice between the three will come down to the type of trader you are, the type of UI you prefer for charting software, and the subscription price.
Price Breakdown
eSignal is easily the most expensive of the bunch, with their least expensive plan costing $52/month with 15-minute delayed data, while TradingView’s top tier plan costs less at $49.95/month.
All costs are monthly:

Awards
Being in business for decades, eSignal has won several awards. The most notable is their series of Reader’s Choice Award wins awarded by Stocks & Commodities Magazine.
- Best Real-Time/Delayed Data: 16 times since 1993
- Best End of Day Data: two times since 2006
- Best Stock Trading System: 11 times since 1994
- Best Futures Trading System: 12 times 1993
eSignal has also earned accolades in the World Finance Awards, Trader Planet Star Awards, the UK Forex Awards, and others.
Pros and Cons
Pros
- Best data quality in the industry
- Endlessly customizable
- Deep toolbox of drawing tools and indicators
Cons
- Many addons are quite expensive, and each one has an individual price.
Final Thoughts
eSignal is the industry standard when it comes to charting packages. It’s endlessly customizable, lightweight, easy to use, and has just about everything an active trader could ask for. It’s on the higher side when it comes to price, but you get what you pay for.
Owned by ICE, they probably have the highest quality data in the industry, a factor often overlooked when judging charting software, especially for those on a shorter time frame.
From time to time we refer third-party products or services to you. We may receive compensation from those third parties whose products or services we refer, however, our reviews and recommendations are independent of any compensation we may receive. There is no obligation for you to interact or transact with these third parties.