


An exponential moving average (EMA) is an average price calculation over a specific time period that puts more weight on the most recent price data causing it to react faster to price change.
Traders use moving averages on charts to help determine trend, direction, and strength, and are often used as entry and exit points.
A moving average is essentially a measure of the average price of a security that is derived by averaging out the prices over a given period of time. Traders often use moving averages to gauge market trends in order to raise their chances of success and take trades in the direction of the market.
Moving averages are also useful for identifying support and resistance levels. In addition, they allow traders to take a look at past performance and give a glimpse into where stock prices might go in the future.
In this article, we are going to discuss the exponential moving average (EMA), how it is calculated and how you can use it to make trading decisions.
What is exponential moving average
The exponential moving average is an average price calculation over a certain time period that applies more weight on the most current price data causing it to react faster to price change.
EMA is one of the oldest trading indicators and is used by thousands of traders today. Day traders incorporate this indicator into charts to help determine trend, direction, and strength. Others also rely on it to identify entry and exit points.
How it is calculated
Calculating an exponential moving average (EMA) involves three steps. First, you need to calculate the simple moving average (SMA) for the initial EMA value. Since an EMA has to start somewhere, a simple moving average is used as the previous period’s EMA in the first calculation.
If you want to calculate the SMA of the last 20 days, we simply sum up the values of the last 20 closing prices and divide by 20.
For example: Suppose closing price of a stock for the last 10 days are 1,2,3,4,5,6,7,8,9,10…the simple average is 1+2+3+4+5+6+7+8+9+10/ 10 = 5.5…here 10 is number of days. As new data comes in the average is recalculated, thereby creating a “moving average.”
The second step involves calculating the weighting multiplier for the number of periods you want to calculate for the EMA. To calculate the weighting multiplier, use the following formula.
EMA(current) = ((Price(current) – EMA (prev)) x Multiplier) + EMA(prev)
Keep in mind that the number of periods always has a significant impact on the weighting multiplier.
Once you have determined the SMA and weighting multiplier values, the EMA can then be calculated using the following formula:
(Closing price-EMA(previous day)) x multiplier + EMA(previous day)
Difference between EMA and SMA
Exponential moving average and simple moving average are similar in that they are used to measure trends. Another similarity between the two indicators is that they are used to smooth price fluctuations in a trade and both follow the same principles. However, some differences exist between the two indicators.
- EMA gives more weight to current data of a trading period, while SMA calculates the average price data of the entire period.
- Exponential moving average is different from simple moving average in that a given day’s EMA calculation depends on the EMA calculations for all the days prior to that day. You need far more than 10 days of data to calculate a reasonably accurate 10-day EMA.
- Another difference is that the EMA is slightly more sensitive to price changes compared to the simple moving average. High sensitivity makes it possible for traders to identify a trend faster compared to the SMA.
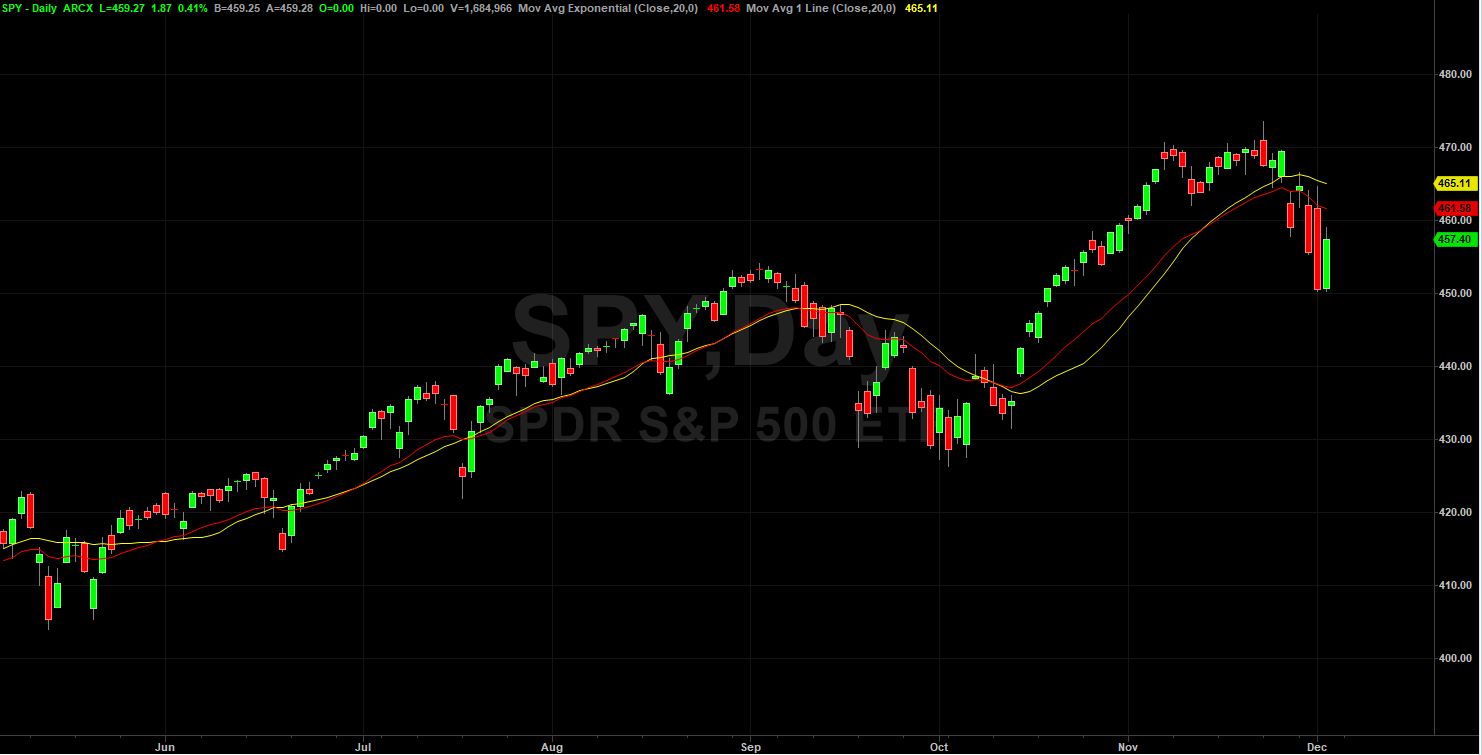
As you can see in the chart above, the red moving average is a 20-day exponential moving average (EMA) and the yellow moving average is the 20-day simple moving average (SMA). The EMA sticks closer to the price action while the SMA is smoother and slower to react to the same price changes. Day traders generally prefer the EMA due to its quickness.
It is important to note the direction of the moving average for market direction for the time period you are trading. Generally traders want to trade in the direction of the trend to improve odds and go with the flow. The 8- and 20-day EMA tend to be the most popular time frames for day traders while the 50 and 200-day EMA are better suited for long term investors.
Sometimes markets will flat-line, making moving averages hard to use, which is why trending markets will bring out their true benefits. Moving Averages can also be beneficial for identifying reversals when stocks are over-bought or over-sold.
Generally stock prices will only get so far away from the moving averages before coming back to test the moving averages and then continue on their trend. Whether you are new to trading or have been doing it for a while, you will definitely find them to be beneficial in your trading.
Using EMA to make trade decisions with example
There a few ways that traders can trade with the exponential moving average.
- Generating buy and sell signals: Traders can rely on the EMA to generate buy and or/sell signals. This happens when one moving average crosses over another. For example, you can trigger a trade signal by having a slow average cross a fast average.
Example
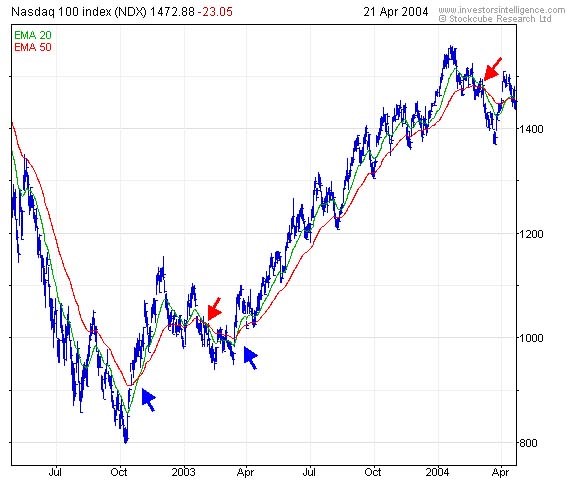
The chart below shows the Nasdaq 100 index with 20 and 50 day exponential moving averages.
A buy signal would be generated when the 20 day EMA (green line) crosses above the longer term 50 day EMA (red line). On the other hand, a sell signal would be generated when the more sensitive 20 day EMA crosses below the 50 day EMA.
The blue arrows represent the buy signals, while the red arrows show the sell signals.
- Provide dynamic support and resistance levels: Exponential moving average periods like the 20, 50, 100 and 200 can also work as support and resistance zones, which is the key to price action and profit in the market.
- Trend trading: Other traders use the EMA to track the primary trend. If the stock closes beyond the average, the trader exits the trade.
Limitations of EMA
As with all moving averages, exponential moving average has its limitations which we will lay out in this section.
- It has the lagging indicator as it relies on some past price movements. This means the stock may or may not go up in future as per the EMA.
- Although it indicates present trend of the stock, it can’t surely forecast future trend of the stock.
- Crossover strategy for entry fails to work many times.
- It is more vulnerable to false signals and getting whipsawed back and forth.
Bottom line
The exponential moving average is one of the most commonly utilized stock trading tools. It is often used by traders to determine entry and exit points of a trade based on where the price action sits on their trading charts. If it is low, the trader may consider a buy, and conversely if it is low, a sale or short sale.
However, traders ought to use the EMA along with other trading tools, most commonly relative strength index (RSI), moving average convergence divergence (MACD), and others.