


Finviz Review
-
Value For Investors
-
Value For Day Traders
-
Commission & Fees
-
User Friendly
-
Customer Service
-
Platform & Tools
Summary
Finviz is a relatively powerful, easy-to-use scanning tool that will not break the bank. It should be a tool that all new traders need to have in their toolbox. Once you have established yourself as a consistent and profitable trader, then you can look at some of the more advanced scanners which offer individualized customization and real time “live” data

Finviz is very easy to use and ideal for beginning traders. You won’t need to know any in depth scanning language or Wall Street insider language to be able to get started using it. The menu is easy to use and a lot of the options you will look to use are set up in easy to use drop down menus.
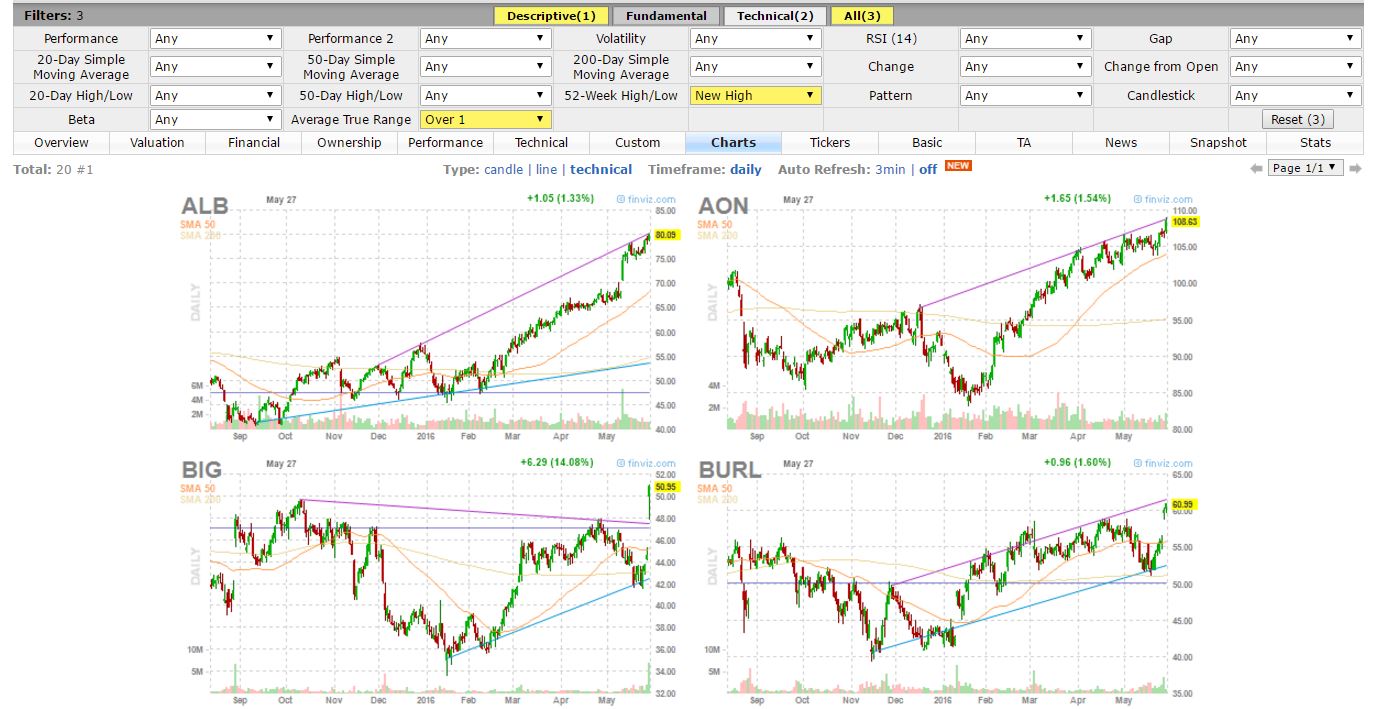
For example, if you want to only see stocks that are hitting a 52 week high, have an ATR of over 1, and a current volume of over, 6 quick clicks and in seconds you have filtered thorough over 7k stocks to a workable list of 20 or less.
But, that’s not even the best part.

The best part is that Finviz is that they have an awesome free option! When you are a new trader just getting started, keeping your monthly expenses for tools and subscriptions down is important because they all eat away into any profits that you may be realizing.
Now they do offer a paid subscription called Finviz Elite, remember, you can find just about everything you need as a new trader with the free version.
Once you’ve completed our Trading Courses here at Warrior Trading and established your identity as a trader, you can consider purchasing a more advanced and powerful scanning program like Trade Ideas which we use in chat every day.
But until you get to that point Finviz is a solid free alternative while you are learning.
Finviz Features and Services
The Finviz homepage features a general overview of the global stock market. Part of the data is split into candlesticks charts under DOW, NASDAQ AND S&P 500 which gives traders and investors a quick look at the global market performance.
Below the candlestick charts, you have part two – different tables listing the top gainers, new high, over bought, top losers, new low, oversold, news, major news and earnings release. You will also find tables listing the latest insider trading, top insider trading, futures and forex bonds.
Lastly, you have a small map displaying stocks categorized under different fields/industries namely:
- Technology
- Financial
- Services
- Basic materials
- Consumer goods
- Industrial good
- Utilities
As a guest browsing Finviz, all quotes presented on the home page are delayed by 15 minutes for NASDAQ and 20 minutes for AMEX and NYSE.
While the Finviz home page is designed to provide a lot of market information, it’s wise to register for an account in order to find stocks and futures that suit your portfolio.
Main Menu
To enable users browse the platform much easier and find market data they are looking for, Finviz has an intuitive menu that includes the following items:
News
Stock market news is very important as this is key to selecting winning stocks and making the right decisions when it comes to entering and exiting a trade. The page provides a list of the latest news which is sourced from industry leading news providers like CNN, Bloomberg, MarketWatch.com, BBC, The New York Times, CNBC and others.
On the same page, you have news from industry leading blogs such as ZeroHedge.com, MarketRealist.com, Mish Talk (themaven.net) and the Big Picture (ritholtz.com). Finviz users also have the opportunity of locating their favorite blogs if they are missing on the page.
On the upper right corner under “missing your favorite blog here?”, you can choose to view the blogs by time or source. As a result, you will have more information to make informed decisions.
Screener
As an advanced stock screening tool, traders and investors have the opportunity of filtering stocks by descriptive, technical or fundamental indicators. They also have the option of filtering data using every available indicators under “All” section which combines those from descriptive, fundamental and technical.
Basically, they can locate the right stock by using criteria such as exchange, market capitalization, price, average volume, debt/equity ratio, profit margin, performance, chart patterns or among the 60 other criteria.
From your search, data will be displayed under the following columns:
- Ticker
- Company
- Sector
- Industry
- Country
- Market Cap
- Map
- P/E
- Price
- Change
- Volume
To save your portfolio or create an alert, you need to register which is free, of course.
Finviz Maps
As a visual tool, it’s designed to give traders and investors a quick summary of how a particular stock is currently performing. The map is divided into several sections/industries which include:
- Technology
- Services
- Basic Materials
- Financial
- Consumer Goods
- Health care
- Industrial Goods
From the left panel, you can select the map type, data set and even locate a ticker on the map.
Let’s assume a trader wants to know how companies under “Internet Information Providers” which include Google and Facebook among others are performing. All one has to do is hover their mouse over that particular ticker on the map.
When you hover over a stock/ticker, you will get to view its 3 month history graph and all its main competitors too.
To open all stocks under a single industry for instance “Technology”, simply double click on it and if you want to have a full view of a particular stock say “GOOGL”, double click on it to open. The map is color coded and the key is available at the bottom of the page.
Remember, you can use the mouse wheel to zoom in and out of the map for a broader or closer view.
Groups
This page helps to provide a performance snapshot of all industries. Users have the opportunity of filtering the data by Group and Order.
Under Group, users can either select one of the following choices:
- Sector
- Industry
- Country
- Capitalization
Under country, data displayed will be for US stocks only. In addition, users can select to have the data displayed in tabular form, Bar chart, charts or grid.
Portfolio
Just as the name suggests, the menu item “Portfolio” displays your current list of assets. This feature is available to registered users only. As a guest, if you click on the link, you will be redirected to the log in page.
If you are a registered user, add your credentials and you will have access to your portfolio. You can now buy and sell securities of your choice and even save your portfolio.
In addition, you will have access to a private forum which enables you to interact with other traders and share ideas.
Insider
If you want to view the latest insider trading, the top insider trading or the top 10% owner trading, then this is the right link for you. The data displayed is categorized in tabular form under the following columns:
- Ticker
- Owner
- Relationship
- Date
- Transaction
- Cost
- Shares
- Value ($)
- Shares Total
Users have the opportunity of filtering the data according to “All Transactions”, “Buy Transactions” and “Sale Transactions.”
Futures
To have a quick look at the Futures market and how it’s performing, click on the “Futures” link. Under Quotes, the data will be displayed as a color coded map. You can view the key above the map for better understanding.
If you select Performance, the data view will change to bar charts and if you select Charts, the data view will change to candlesticks for different markets.
Forex
This page has a similar look as the Futures page. Data is displayed as a color coded map that shows the performance of different currency pairs from around the world. Just like in Futures, you can change the data view between Quotes, Performance and Charts.
Cryptocurrency
The Crypto page lists different cryptocurrency pairs as a color coded map. Users have the opportunity of checking how different cryptocurrencies are performing and they can switch the data view between Quotes, Performance and Chart too.
Backtest
As the second last menu item on Finviz, it is designed to help users make better trading decisions thus maximizing their returns. It is available to registered users only specifically Finviz*Elite users. Once you subscribe, you will get to play with additional features such as:
- Advanced charts
- Access to real time and pre-market data
- Performance tracking of correlated stocks
- Advanced stock screener
- Profitability research on technical indicators
- Alerts and notification about important events
Finviz Fees
As a guest or registered user (free account), you can access all menus available on Finviz. The only problem is you will be limited in terms of features. For instance instead of real-time quotes and charts, yours will be delayed.
To enjoy more features as provided by Finviz, you can upgrade your free registered account to Elite status. At the moment, users have the choice of selecting between Monthly and Yearly subscriptions as follows:
Monthly @ 39.50 a month
Yearly for $299.50 or $24.96 a month
Remember, this is a single user license only and users have the chance of cancelling their subscription anytime.
Downsides
While Finviz provides most of the parameters that we use every day to screen stocks, the main challenge with using Finviz is the inability to customize the screening parameters.
For instance, if you want to scan for stocks that are up a certain percentage on the day, your choices are like +5%, +10% and +15%.
You can’t enter a custom value like 3% or 6% like you can in Trade Ideas. Also it does not have the ability to run historical scans so that you can back test. Another area where Finviz can present a challenge is the data speed.
I provide great information for nightly scanning but is very limited to provide intraday scanning. It can become a bit more effective after the first hour or 2 but it’s data feed will keep you out of the quicker moving intraday setups.
Other than being free, one of the good things about Finviz is that you can save your settings for later, so you don’t have to reenter them every time you come back the site to use it again.
Another impressive element to Finviz is how the scan data is presented. You have a choice of 14 different ways to get the info from the results of the scan based on what you are looking for.
The daily charts that you get are pre-populated with the 20, 50, and 200 sma’s along with the ascending and descending support and resistance lines drawn.
It also identifies several chart patterns such as ascending and descending triangles, wedges and channels. This allows you to quickly see the patterns analyze the chart and determine a course of action.
Final Thoughts
Finviz is a relatively powerful, easy-to-use scanning tool that will not break the bank. It has a solid free option to use there scanners but they also have subscription if you want access to some of their more sophisticated tools.
It should be a tool that all new traders need to have in their toolbox.
Once you have established yourself as a consistent and profitable trader, then you can look at some of the more advanced scanners which offer individualized customization and real time “live” data.
However, if you have established yourself primarily as a swing trader, Finviz may be the only stock screener you will ever need.