

Reversal Trading Written Strategy
The Reversal Trading Strategy
The Reversal Trading Strategy is for trading stocks that are at intraday extremes of over bought or oversold.
Stocks to consider:
Stocks hitting either New Highs or New Lows
Avoid stocks where the entire sector is selling off (oil, bios, etc)
Chart Patterns:
MUST have at least 5-10 candles in a row
MUST be riding the Bollinger Bands
MUST be at least 40 cents above the 9ema otherwise can’t justify 20 cent stop.
A Doji outside the Bollinger Bands is preferred for an entry candle
9ema must be at least 40 cents away otherwise can’t justify 20 cent stop.
Technical Indicators:
RSI below 10 or above 90 is preferred 20/80 is acceptable
Position must be at low of day or high of day, not an intraday pull back.
Red Flags
A stock needs to reverse quickly vs flag near the highs/lows.
Consolidation along the highs/lows is not good for a reversal
How to Buy
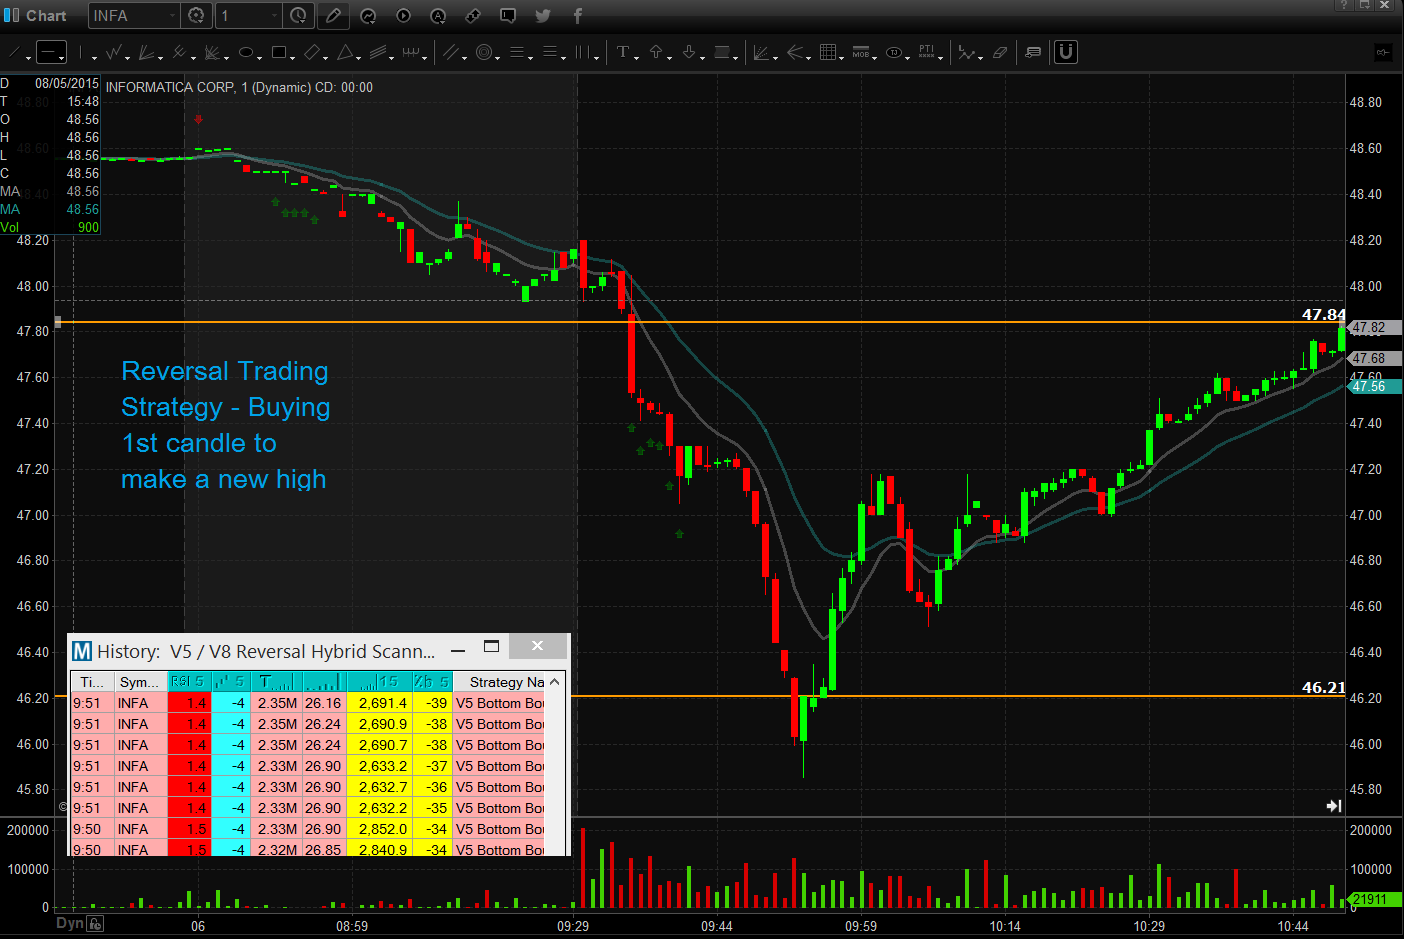
- Buy the first 5min candle to make a new high
- Buy the first 1min candle to make a new high if you are confident, typically 1min is too choppy.
Stop Price
- Always stop down 20 cents for typical position sizes, if small size stop at high or low
- If they don’t immediately pop, bail out. Look for immediate reversal
How to Sell
- Hold a partial position with stop at Break Even, these stocks sometimes trend for the rest of the day.
- Adjust stop to -50 cents when you are up more than 50 cents. Keep adjusting a 40-50 cent stop or stop a little bit above support/resistance level. Try to hold partial as long as possible.
- Sell half when you’re up 40 cents (2:1 p/l ratio)
- If they don’t immediately pop, bail out. Look for immediate reversal
Position Sizing
- Using a 20 cent stop I’m risking not more than $1k/trade. Max initial size of 5k.
- Use 2k as base position size, double if it’s strong to 4k, triple to 6k if really good.
Statistics
- Success rate (lower success rate, higher p/l ratio) (target 60%)
- Profit Loss Ratio target is 2:1 (higher profit loss ratio)
- Average Trades per Day:
- Average Winning Day Profit:
- Average Losing Day Loss:
- Anticipated Profit over the course of 1 month:
- Anticipated Profit over the course of 1 month if double position size: