

An oscillator is a technical indicator that is used to help determine over bought/sold conditions or to confirm the strength of a trend. Oscillators use a scale between 1 and 100 that smooths out prices using price averages over a give time frame.
Oscillators are usually used in conjunction with other technical indicators to help confirm the price action.
Over bought/sold conditions are marked off by the red lines at the bottom of the examples below with overbought being reached when it gets over 80 and oversold when levels get below 20.
There a few different oscillators that traders use with the MACD, stochastics and Relative Strength Indicator (RSI) being the most popular.
There are different strategies you can use with this indicator including a contrarian trade when oscillators are at extreme levels and when there is convergence/divergence.
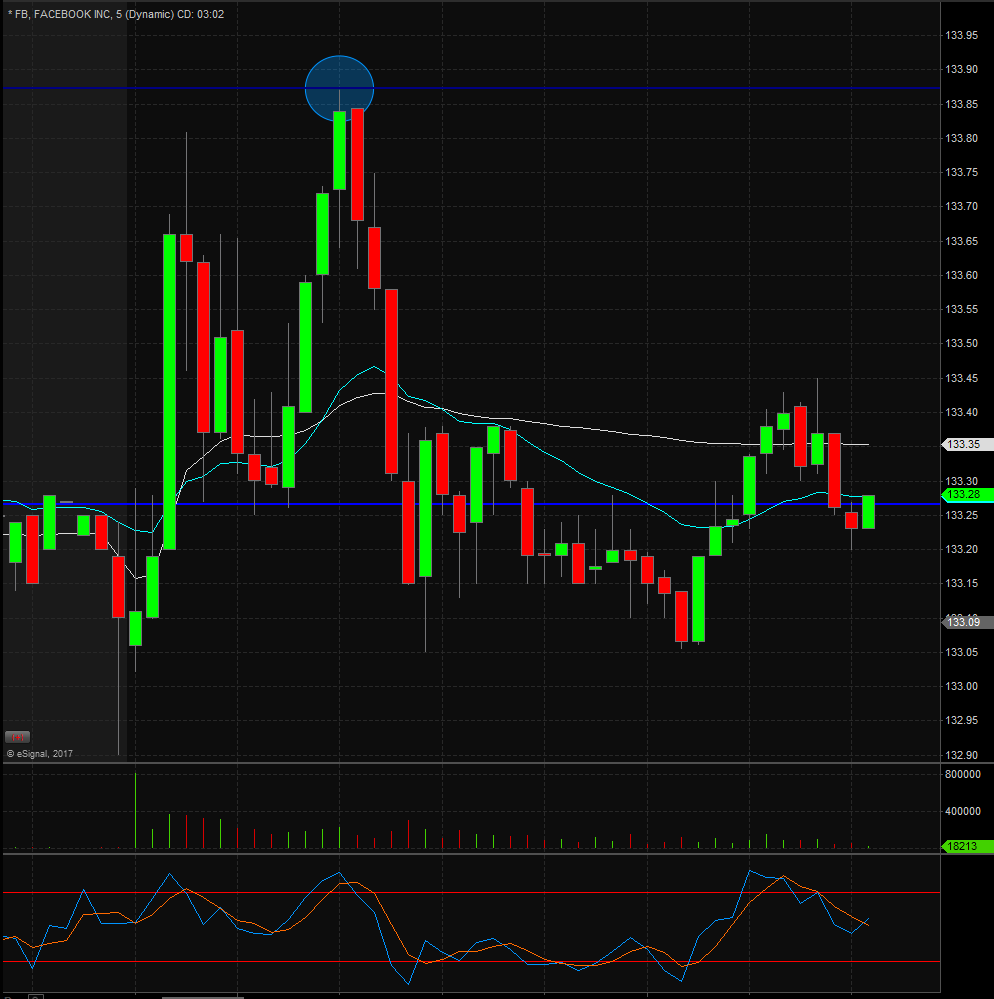
In the above example we have a contrarian setup where $FB is trading higher till the oscillator at the bottom (stochastic) is in very over bought territory, as denoted with the red lines, and it has also reached a key floor trader pivot, which stopped it in its tracks with a hard reversal.
This is a great trade setup with an easy to identify stop exit and profit targets at the moving averages or VWAP.

In the above example you can see that prices edged higher marked off with the blue trend line but if you look at the oscillator below you will see that it didn’t make a high above the recent peaks which is indicative of a reversal and is known as divergence.
These can be harder to find as sometimes they are very subtle difference but can be an great trade set up if you find one.
Warrior Trading Pro Tip
When using oscillators it’s important to understand that they are important indicators BUT they are also limited and are not the best for being used by themselves.
However, they are great to confirm price action when used with other indicators like floor pivots or other key pivot points. The above examples are just a couple of trading strategies you can use with them and ones that I actually use on a daily basis.