

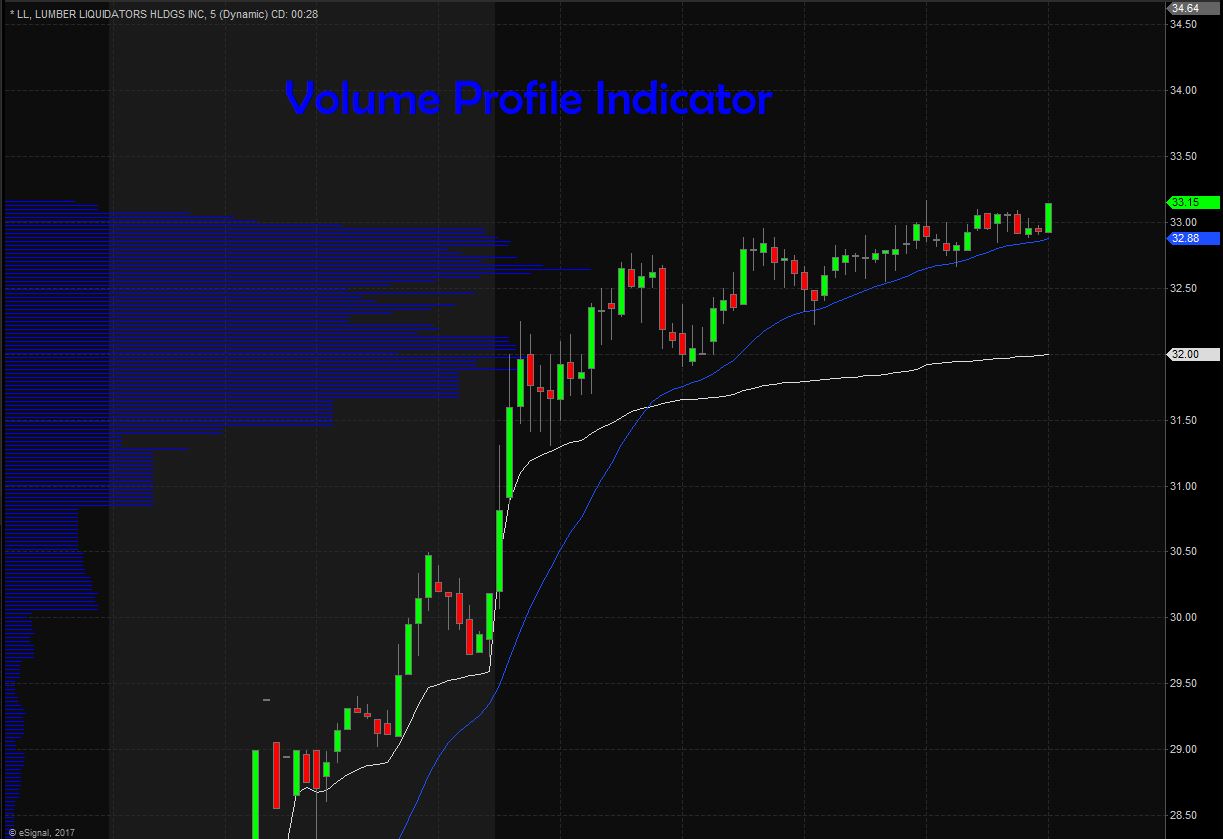
This refers to an advanced charting study used to show trading activity spanning a particular trading and price levels. Also referred to as volume by price, it helps to display the amount of volume occurring at certain price levels and range as opposed to most volume indicators that display volume based on a certain time frame.
On a trading chart, the Volume Profile is represented by horizontal bars which are shown on the right corresponding to each price. When volume and price are combined, the trader is able to identify high volume price ranges thus indicating support or resistance.
It is important to note that Volume Profile updates when a new trade order is filled. Furthermore, it also occurs when the point of control, value area, high and low volume nodes change several times during a particular trading session.
As it develops (volume profile) especially during the entire trading session, new patterns will be noted plus new trading opportunities will emerge.
When to trade with Volume Profile
Support and resistance levels
Savvy traders use Volume Profile to identify basic support and resistance levels. As a reactive method, it utilizes past price movements and volume behavior. That is why it’s useful when it comes to the application of meaning to price levels especially for a previously visited market.
In trading, support level is where the price level cushions the price as it moves down while resistance level helps to provide intransigence as price moves up.
To conclude, price level located close to the profile’s bottom favors the buy side which is a good indicator of support level while price level close to the profile’s top favors the sell side which in this case is a good indicator of resistance level.
Cyclical nodes
When trading with Volume Profile, the developing high volume nodes usually display significant intraday trading thus reflecting the most popular prices for that particular trading session. On the other hand, low volume nodes help to display prices that receive little attention.
It is important to note that high volume nodes usually experience a strong pull and that is why traders will always navigate towards these areas. This happens even when the prices are either rising or falling.
When it comes to low volume nodes, they experience less pull leading to the market bouncing. This results in low volume nodes not staying long because they experience less pull.
Thanks to the cyclical nature of the volume nodes, trading opportunities will emerge. For example high volume nodes help to identify where smart money is trading. In other words, high volume nodes show locations for trade exits while low volume nodes provide good trade entry locations.
Final Thoughts
Volume Profile helps to show traders where to enter and exit a trade. Furthermore, it helps to show how much volume has been traded within a particular trading session.
As a result, it has been identified as a valuable technical analysis tool that should be used by traders. Traders can incorporate it in their trading strategies and improve the probability of making profits.