

What is support level?
This is the price level whereby demand of a security is strong enough thus preventing the decline in price. In other words, it is the level at which investors or traders jump in to buy securities while sellers become less inclined to sell their shares.
According to savvy investors and traders, it has been found out that when prices attain support level, demand overcomes supply. As a result, the price of securities is prevented from declining further than the support level.
As a point where many buyers and sellers converge, volume increase is imminent. The more the buyers are attracted, the more the prices bounce off the floor. This helps to confirm support level.
If more sellers are brought in, the price will fall through the support level. As a result, support level turns into a new resistance level.
How to identify support level
As a beginner, it is quite difficult to establish where to draw the trend lines in order to identify support level. Here are 4 steps to help you achieve this.
Use historical data
As a beginner, you are currently learning the ropes about swing trade so; it’s wise to use historical data. Not only does it provide you with valuable data that you can test on but it eliminates the chances of you losing your capital.
Start by loading 3 to 6 months of data points as this is perfect for identifying short term support. Furthermore, the chart will not be too squeezed. If you are looking for a challenge, you can opt to try out long term. For this, load data points that span 8 to 12 months.
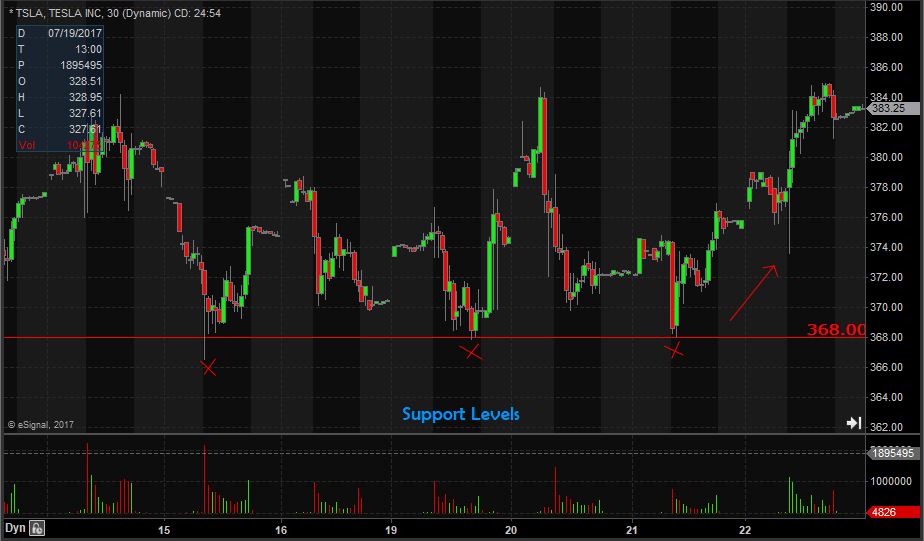
Locate three price action zones
Before we proceed, it is important to understand what a price action zone is. These are sticky points found on the chart and are characterized by sharp reversals, uptrend or downtrend.
Once you identify the sticky points, mark them. One important point to remember is that your price zones should be well spaced in time. For example if the first price action is identified on the first week of April, the second price action should be on the third week of April.
Align the zones
Now that you have identified your three price action zones, it’s time to align them. To ensure the best results, use price range. If they are not aligned, you should ignore the points. Only identify those that align horizontally.
Draw the trend line
By now you understand how trend lines are vital in trading and technical analysis. Using your horizontal trend line, connect the three price action zones. This should be in respect to the current market price range.
By doing this, you will have two horizontal lines. The upper line will mark the ceiling while the bottom line will mark the floor or support level. And that is how you identify support level.
Final Thoughts
It is vital to understand that support level is very important in swing trading. To predict support level, experienced traders use horizontal trend lines on a stock price chart.
To identify it conclusively, three highs or three lows are required in the same area. Patterns do gain greater validity every time stock prices achieve support level and as a result, buyers are able to identify trading opportunities.