


Failing to prepare is preparing to fail . . .
Building a watchlist of tickers that you’re interested in trading for the day is an essential part of a profitable trading process.
A watchlist is simply a short-list of stocks that meet or might meet your criteria for a profitable trading setup.
While your daily watchlist should evolve throughout the trading day, before the market even opens, you should have a healthy list of tickers on to watch for emerging setups.
There are roughly 13,000 issues that trade on the US exchanges,
The Trading Idea Generation Process
You might be a reasonably skilled trader with a book of profitable trading setups.
But, if you wake up at 9:15 AM and attempt to blindly trade the open with no preparation, at the very least, you’re missing the most favorable opportunities, and on many days you’ll get crushed.
As a trader, fresh ideas are your fuel. Let’s go through each step of the process, start to finish, of creating your trading watchlist each trading day.
Step One: Define What You’re Looking For
The first step in your trading idea generation process is to be clear about which setups you’d like to trade. You know what they say about generalists, “a jack of all trades, master of none.”
Pick your two or three highest conviction setups to scan the market for setups and focus on those.
Whether that’s a bull flag, failed breakout, or test of support or resistance, write your setups down and be clear about what they are, how you trade them, and how you identify them in your scanning process.
For example, if I only trade pullbacks in uptrends, here’s how I might write out my basic trade plan:
- Setup: Trend pullback
- Criteria: Series of higher highs and higher lows with strong momentum and volume.
- Warning signs: Don’t enter the trade on a dramatic pullback, this could be the sign of a reversal
- Green flags: Look for a shallow pullback into a consolidation on light volume and momentum.
- Exit criteria: Use a multiple of the time-frame’s ATR or the recent swing low as a stop loss, depending on the market conditions.
Now I have a concrete idea of what I’m looking for in my screener or scanner.
This transforms your idea generation process from just “looking for interesting charts” to looking for a particular situation and disregarding all the other charts.
Step Two: Creating a Screen or Scan
This is where the process will begin to differ depending on your trading style.
If you’re a short-term day trader, making trades off the 1-minute or 3-minute chart, you’re likely using a real-time stock scanner like Trade-Ideas to quickly find opportunities as they arise.
If you hold your positions for longer, even overnight, you probably utilize a screener like FinViz.
The specificity of your scanning criteria will ultimately depend on your preferences. The more specific you are, the fewer results you’ll yield, but those results are probably more accurate.
On the other hand, with broader criteria, you’re much less likely to miss out on a great opportunity that tighter criteria missed.
Let’s take some example criteria for my hypothetical trend pullback setup. Perhaps I prefer to trade low-float stocks because of the more extreme price moves they make.
- Market Cap < $2B
- Float < 50M shares
- Price > $1.00
- Average Volume > 100K shares/day
Just with the above descriptive criteria, I’ve narrowed FinViz’s 7,546 stock universe down to only 266 stocks.
Now let’s look at the differences between broad and specific screens for this strategy.
Here’s an example of a pretty broad screen that yields 56 stocks, a manageable list of charts to quickly cycle through for adding to your watchlist.
- Price > 20-day simple moving average
- Price 0-5% below 50-day high
- Change: down on the day
On the other hand, if we wanted to pinpoint trend pullbacks more accurately, we’d have to code our own solution.
For example, perhaps a specific mechanical criterion in our hypothetical trend pullback setup was the following:
- Price > 20-day simple moving average
- Price has closed above 5-day simple moving average 7+ days in a row, but closed below it today
While the above screen has fewer criteria, the criteria are much more specifically targeting a pullback and will yield fewer results.
However, most trend pullback trades will not meet these criteria, so we’d miss out on several potential opportunities. This is a weighing process in which you have to test yourself and come to your own conclusions.
Using the pseudocode tools provided by trading platforms like ThinkOrSwim, TradeStation, TradingView, or NinjaTrader, you could probably learn to code a script that screens for your specific setup within a few hours.
For example, there’s an online community for ThinkScript users called UseThinkScript, featuring several tutorials and forums on writing custom ThinkOrSwim scripts.
Step Three: Reviewing Your Screen Results
Here’s where we actually build your watchlist.
Now that you’ve screened the market for opportunities and have a list of stocks that potentially meet your trade setup’s criteria, it’s time to examine each chart and each setup candidate to your watchlist.
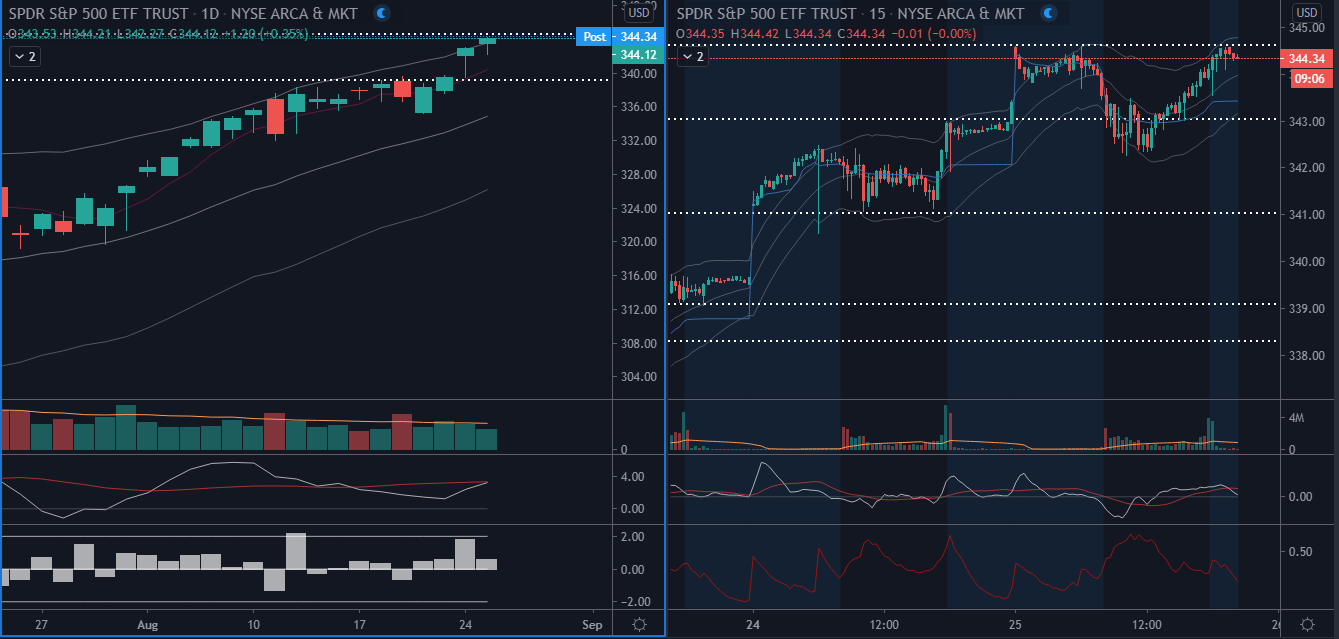
I use TradingView and prefer to use a two-pane chart setup to view both the daily chart and the 15-minute chart to see how the action is unfolding on both the higher and lower time frames.
Depending on your trading time frame, you should manipulate this.
For example, a 1-minute chart trader should have the 1-minute chart in one pane, and perhaps the 30-minute chart as the higher time-frame.
The use of multiple time frames is essential. You have to avoid getting into a lower time frame “tunnel vision.” In many cases, traders will try to short against resistance on a lower time frame like a 5-minute chart, while the daily chart is in a strong uptrend.
It helps to know where the longer-term momentum and volume is flowing.
Here’s an example of a favorable chart setup for scanning through a watchlist:
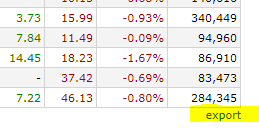
Many screeners and scanners allow you to export your results into a CSV or TXT file with the list of tickers, which you can import into your charting platform for quick viewing.
For example, here’s where to export your list of tickers on FinViz, on the bottom right of your screen results table:
Once you’ve analyzed each chart and added the potential setup opportunities to a watchlist, it’s time to move onto the next step.
Step Five: Analyzing Your Watchlist
By this point, you’ve done the following:
- Outlined your trade setup
- Created scan/screen criteria and screened the market for opportunities
- Observed each chart from your screen results
- Built a watchlist of interesting tickers from the results
Now’s the time where we analyze each ticker from our watchlist in more detail, looking for factors like the following:
- How strong is the potential setup opportunity relative to the average setup that you trade?
- News and catalysts (PR, earnings, dividends, capital raises, analyst upgrades/downgrades, and conferences are examples).
- Look for key levels on the chart, including support and resistance, recent swing highs/lows, and potential entries and stop losses.
Bottom Line
Like most processes in trading, you should follow a system or framework of some sort.
This article outlined a detailed process that you shouldn’t necessarily follow to a tee, but you should have some sort of framework for building your morning watchlist each day.
To summarize:
- Know what you’re looking for when building a watchlist. Keep your key setups in mind.
- Figure out a scanning/screening criteria that works for you. You might prefer to cast a broad net and manually analyze dozens of charts. Others might prefer to code a script that pinpoints the exact stocks that meet your setup’s strict criteria.
- Build a quick watchlist out of your scan results
- Build your final watchlist after analyzing each ticker from your quick watchlist for key levels and catalysts.