


The Simple Moving Average (SMA) is a popular moving average that takes an average price calculation over a specific time period.
Intro
Moving averages (MA) are popular among technical analysts, investors and day traders around the globe. MAs collect the closing price of a given stock for a specified period of time, normally over a number of days, and then averages the price and plots it as a line on a chart.
There are thousands of moving averages including the weighted, displaced, exponential, triple exponential, and simple moving average. However, the most used moving average types are exponential moving average (EMA) and simple moving average (SMA).
In this article, we will focus on the SMA including how it is calculated, how its differs from the EMA, and how traders can use it to make trade decisions.
What is the Simple Moving Average
The simple moving average (SMA) is an average price computation of a stock over a set time frame. It takes the sum of past closing prices over a specified period of time and divides that number by the number of data or price points. This gives you the average price of that stock for that time period.
SMA is one of the most important indicators in technical analysis and is usually the easiest moving average to construct. The reason technical analysts and day traders call it “moving” is because the stock price constantly changes, so the moving average changes accordingly.
How it’s calculated
SMA is calculated by adding the price of a stock over a number of time periods and then dividing the sum by the number of time periods. If you want to calculate the SMA of the last 10 days, we simply sum up the values of the last 10 closing prices and divide by 10.
For example: Suppose the closing prices of Apple stock for the last 10 days are $50,$52,$55,$60,$65,$62,$58,$72,$75,$70…the simple average is $50+$52+$55+$60+$65+$62+$58+$72+$75+$70/ 10 = $61.9…here 10 is number of days.
As new data comes in the average is re-calculated, thereby creating a “moving average.”
Differences between SMA and EMA
Simple moving average and exponential moving average are similar in that both follow the same principles and are used to measure trends and smooth price fluctuations. However, there are some key differences between the two.
- One major difference between SMA and EMA is that SMA calculates the average price data of the entire period, while EMA puts more weight to recent data of a trading period. This means EMA moves much faster and changes its direction earlier than the SMA.
- SMAs represent a true average of prices for the entire time period. As such, they may be better suited to identify support or resistance levels unlike EMAs which react faster to recent price changes.
- SMAs can keep you in trades longer when there are short-lived price movements and erratic behavior, while the EMAs start to turn down immediately when price retraces lower during a rally and it can signal a change in the direction way too early.
- Simple moving averages also tend to have more lag than exponential moving averages.
Using SMA to make trade decisions
SMA is an important trend trading indicator that is used by day traders in a number of ways, which include:
- Determining entry and exit signals using cross-over strategy
One strategy day traders look for is the moving averages to “cross-over.” A moving average crossover happens when a moving average line crosses over another. This strategy can help you identify when to get in and out a trade.
If a moving average crosses over one another, it could be a sign that the trend is about to change soon, thus gives you the opportunity to get a better entry.
Example
The chart below shows an 8 and 20-day simple moving average, where you will notice prices tend to respect the moving average.
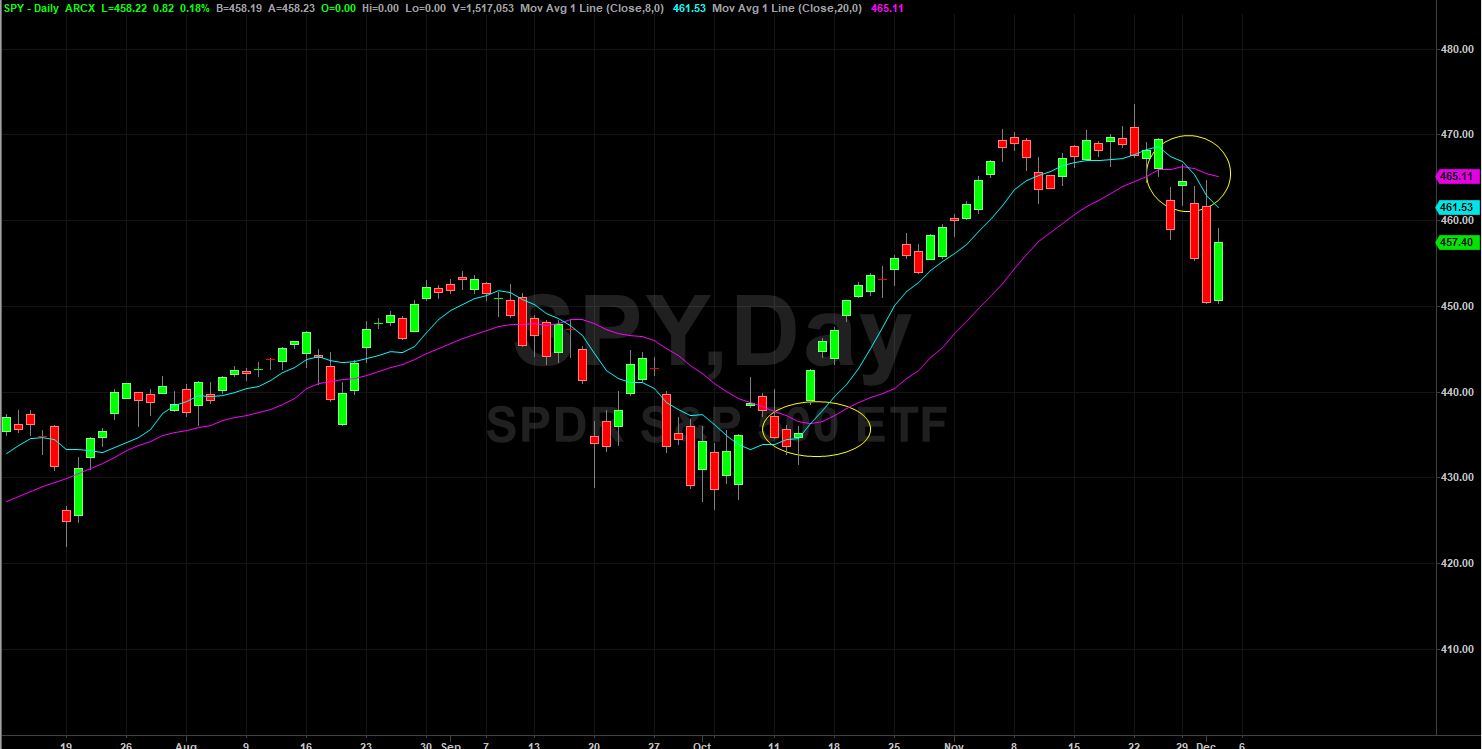
You will notice the circle on the chart marks where the 8-day SMA crosses over the 20-day SMA, marking a possible turning point in the trend and an ideal point to look for a trade entry.
- Identifying trend direction: SMAs are also often used to gauge trend direction. If the SMA is moving up, the trend is up. If the SMA is moving down, the trend is down. Shorter period SMAs can be used to determine shorter term trends.
A 50-bar SMA is typically used to determine the intermediate trend. 200-bar SMAs are common proxy for the long term trend.
- Spot areas of support or resistance: SMAs offer a smoothed line which is less prone to a lot of false signal in response to slight, temporary price swings back and forth. Therefore, it provides dynamic areas of support and resistance for trending price actions where potential set up on entry levels can be identified at such areas.
- SMA crossing SMA is another trading signal that is commonly used by traders. When a short-term simple moving average crosses back below the long-term SMA, you may want to go short. You may want to go long when a short period SMA crosses above a long period SMA.
Golden/Death Cross Examples

Above is an example of a Golden and Death Cross on the Apple (AAPL) daily chart. The red moving average is the 50-day SMA and the yellow is the 200-day SMA. Notice how prices continued on their trend after breaking through the 200-day SMA in both directions.
As long as they are holding the 200-day SMA in their perspective direction, then price action should continue to follow the trend.
Limitations of SMA
Although the simple moving average is smoothed and less prone to whipsawing up and down compared to the exponential moving average, it still has some limitations.
- One weakness of the simple moving average is that some of the data used to calculate the moving average might be stale or old, which gives it a “lagging effect.”
- Some traders tend to assume that the 8, 20, 50, 100 and 200 simple moving averages can be effectively applied to all asset classes. But various asset classes have different volatility and time cycles.
Bottom Line
Traders look at the simple moving average to follow the price movement of a given stock, whether up or down. This indicator can also serve as support or resistance and is often used to identify when a trend might be emerging or when a trend might be ending.
In addition, it can be used to monitor trend and identify entry and exit points.
Remember that simple moving averages can be customized for any length of period that you want.
However, the 8 and 20 are the most popular among day traders, though any length can be used based on your personal preference and trading style.