

A Golden Cross is an indicator for bullish breakout patterns that are formed when an asset’s short-term moving average (STMA), such as the 50-day, crosses over its long-term moving average (LTMA), such as the 200-day.
These crossings signify breaks above key levels of resistance. Since the LTMA indicator is more influential, golden crosses are indicative of an upcoming bull market that is reinforced by increased trading volumes.
Golden crosses involve three stages. The initial stage is made up of the lengthy downtrend that gradually reaches the trough when the selling pressure is exhausted. During the second stage the STMA crosses over the LTMA, indicating the trend reversal and bullish breakout.
The final stage involves the continuation of the positive trend through significantly higher prices. The STMA and LTMA are then support levels during pullbacks until they cross back over in the opposite direction, which is known as the death cross.
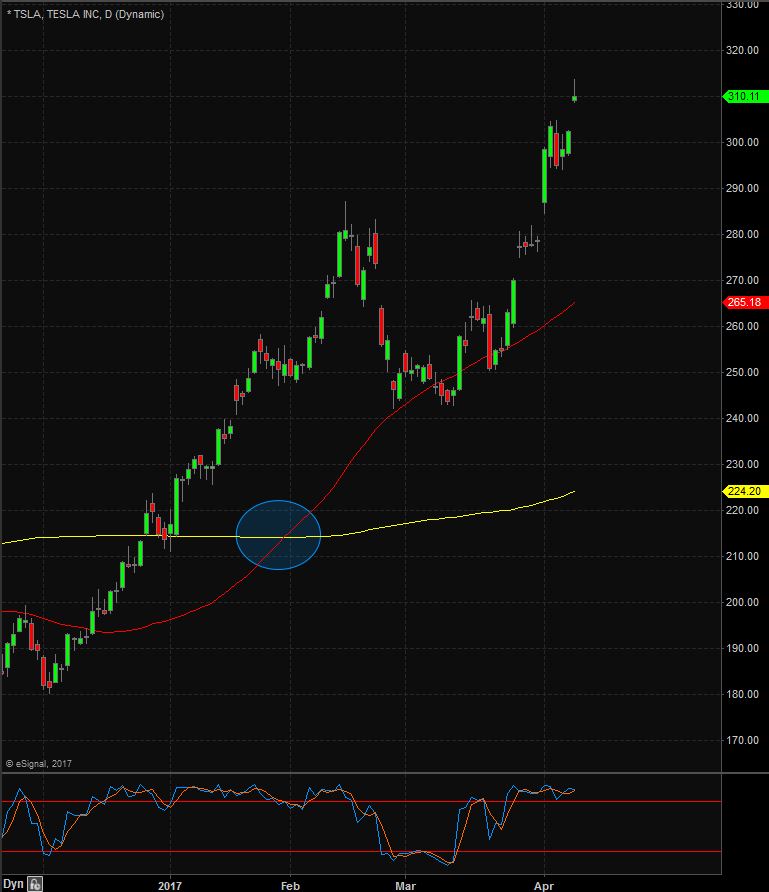
In the above example you will see that TSLA had a Golden Cross where the moving averages crossed over and has since been in a strong uptrend.
Golden Cross Applications
Most often it is the 50-period and 200-period moving averages (MA) that are used. In general, the bigger the time period used, the stronger the breakouts that form.
The 50-day MA crossovers on the 200-day MA for an equity market index, for example, is strong indication that the market will be bullish in the near term, which indicates the ideal opportunity for entering equity positions and trading on sector shifts within the broader index.
Day traders will often employ smaller time periods to trade on intra-day breakouts. However, the shorter the time periods used, the weaker and less reliable the ensuing breakouts tends to be.
Golden crosses can be used alongside numerous momentum oscillators (stochastic, relative strength index (RSI) and convergence divergence (MACD)) for tracking when the resulting uptrend becomes overbought or oversold. These supporting momentum oscillators will aid in spotting the ideal entry and exit points for trades.