
- What Is a Moving Average and Why Do Day Traders Use Them?
- The Most Popular Moving Averages for Day Trading
- The 200 Moving Average
- The 20 Moving Average
- The 9 Moving Average
- Exponential vs. Simple Moving Averages
- How I Actually Use Moving Averages When I’m Trading
- Using Moving Averages as a Go or Stop Signal
- Moving Average Crossovers
- Moving Average Pullbacks in Day Trading
- Why These Setups Can Be Powerful and Risky
- The Alligator Indicator and Moving Average Alignment
- Common Mistakes Traders Make With Moving Averages
- Final Thoughts on the Most Popular Moving Averages for Day Trading
Watch Full Video Here: The Moving Average Trading Strategy You Need! (Full Training)
Moving averages are one of the most widely used technical indicators in day trading, and for good reason. I use them every single day, not because they predict the future, but because they help me understand trends, momentum, and when I should be trading and when I should stop.
In this article, I’m going to break down the most popular moving averages for day trading, how I use them in real trades, and why keeping things simple matters more than loading your chart with indicators.
What Is a Moving Average and Why Do Day Traders Use Them?
A moving average is exactly what it sounds like. It’s the average price of a stock over a specific number of candles. You calculate it by adding up the prices of a set number of candles and dividing by that number.
For example, if prices are 5, 6, 7, 8, and 9, the average is 7.
Why does that matter? Because when the price is above the average, it’s generally bullish. When it’s below the average, it’s generally bearish. That alone makes moving averages incredibly useful for day traders.
I often remind traders that moving averages can act as:
- Support when the price is above them
- Resistance when the price is below them
They work especially well because other traders are watching the same levels. When enough traders agree that a level matters, it tends to matter.
The Most Popular Moving Averages for Day Trading
There are dozens of moving averages traders talk about, but in practice, only a few really matter. I keep my charts clean and focus on the ones that consistently show up in real trading.
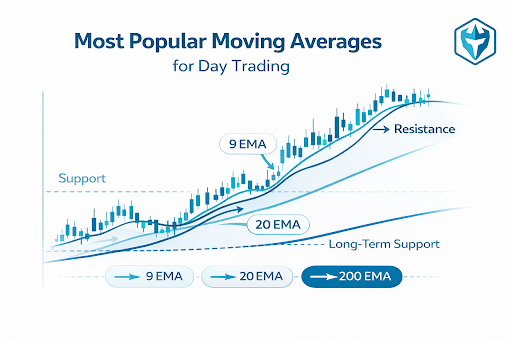
The 200 Moving Average
The 200 moving average is one of the most respected indicators in the market. On a daily chart, it represents the average price over the last 200 days. On intraday charts, it represents the average price over the last 200 candles on that timeframe.
I’ve seen countless examples where price comes down to the 200 moving average and bounces cleanly. If the price is below the 200, that same level often becomes resistance.
When I see a stock approaching the 200, I pay attention. It’s a level where reactions are common.
The 20 Moving Average
The 20 moving average plays a major role in intraday momentum trading. When a stock is trending strongly, price often pulls back toward the 20 and then pushes higher again.
This type of behavior tells me the stock is resting, not failing. It’s one of the reasons the 20 moving average is so useful for identifying moving average pullbacks.
When price can’t hold the 20, that’s often my first sign that momentum is starting to weaken.
The 9 Moving Average
Many traders ask why I use the 9 instead of the 10. The answer is simple: the 9 is slightly faster.
If you want to trade a crossover, you’re going to use a shorter time frame. The 9 reacts to price changes a little quicker, which means crossover signals happen slightly earlier.
I’ve used the 9 moving average for more than a decade, and it continues to work well for momentum trading.
Exponential vs Simple Moving Averages
There are two main types of moving averages:
A simple moving average weighs every candle equally. A candle from 200 periods ago counts the same as the most recent candle.
An exponential moving average weighs recent price action more heavily. That means it responds faster when price starts to move.
For active day trading, I prefer exponential moving averages. They react quicker, and when you’re trading fast-moving stocks, speed matters.
How I Actually Use Moving Averages When I’m Trading
One of the biggest misconceptions about moving averages is that they’re entry signals. For me, they’re more about confirmation and discipline.
Using Moving Averages as a Go or Stop Signal
Moving averages tell me when to start trading and when to stop trading.
When the 9 moving average is above the 20, I’m interested in trading the stock. When the 9 crosses below the 20, I stop buying. When the 9 moving average crosses below the 20, I should no longer be buying this stock.
That rule alone keeps me out of a lot of bad trades.
Moving Average Crossovers
The 9/20 crossover is something I pay close attention to. A positive crossover tells me momentum is shifting back in my favor. A negative crossover tells me it’s time to step aside.
I don’t blindly buy every crossover, but I absolutely use them to filter which stocks deserve my attention.
Moving Average Pullbacks in Day Trading
A moving average pullback usually happens after a breakout. Price pushes higher, pulls back toward a key moving average, finds support, and then pushes higher again.
These setups are attractive because they allow entries close to support.
Why These Setups Can Be Powerful and Risky
Pros:
- Tight stops
- Strong continuation potential
- Clear support levels
Cons:
- Entries can feel ambiguous
- Not ideal in choppy markets
- Easier trades often happen earlier in the move
By the time a stock pulls back to a moving average, it has already shown some weakness. That doesn’t mean it won’t work, but it does mean you need to be selective.
The Alligator Indicator and Moving Average Alignment
The alligator indicator uses three moving averages: the 5, 8, and 13. When they line up, the market is considered to be “eating.” When they cross against each other, the market is “sleeping.”
The core lesson here is important: only trade when the market is trending.
Personally, I don’t rely on the alligator indicator because it makes my charts feel cluttered. But the concept behind it reinforces the same principle I already follow.
Common Mistakes Traders Make With Moving Averages
One of the biggest mistakes I see is traders using too many moving averages. When your chart has five, six, or seven lines, it becomes harder to make clear decisions.
Another mistake is trying to force moving average strategies in the wrong market conditions. In hot markets, these setups work better. In cold, choppy markets, they’re more likely to fail.
As I’ve learned over the years, part of trading is knowing when not to trade.
Final Thoughts on the Most Popular Moving Averages for Day Trading
You don’t need every moving average to be successful. I focus on the 200, the 20, and the 9 because they consistently help me read trends, momentum, and risk.
Keep your charts simple, manage your risk, and practice in a trading simulator before putting real money on the line. That approach has kept me trading for more than a decade.
If you’re new to day trading, practice these moving average setups in a simulator and take advantage of the educational resources at Warrior Trading.