

What is Time and Sales?
Time and sales, also known as “the tape”, is a record of all stock transactions throughout the trading day and typically includes trade size, price and time of trade.
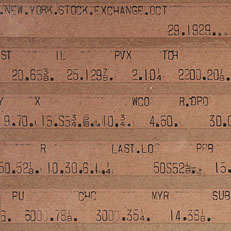
The tape got its name from the mechanical ticker tapes used in the late 1800s and early 1900s. These machines used to print stock prices on small strips of paper, looking like the picture below:
Traders use the tape to identify shifts in supply and demand in markets by developing an intuition for how the tape moves when shifts are occurring.
Prints
An executed trade on the tape is called a print. A print contains three vital pieces of information:
- Time of trade execution
- Price that trade was executed at
- Amount of shares traded
In the below example, we can see that a 108 share trade took place at 1:27 p.m. at a price of $213.21

Bid and Ask Prices
The bid and ask prices are vital to analyzing time and sales data. The bid is the best price that buyers are willing to pay for shares, and the offer is the best price that sellers are willing to take for shares.
Generally, in time & sales platforms, orders that take place on the bid are colored in red, those that take place on the offer are colored in green, and those that trade in between the bid and the offer are printed in white.
This is because when buyers buy at the offer, thats a bullish indicator. The buyer had to “pay the spread” and buy from the offer because there wasn’t liquidity available at the bid price. When this happens several times at once, you may see a supply/demand imbalance beginning to take hold.
Why Traders Use Time and sales
The tape displays the moves of the market’s big players. Because all transactions must be recorded on the tape, they have no place to hide if they’re doing lots of volume. Some traders use that information to follow the big players, while others choose to predict when the big players are done buying or selling, and trade the reversal.
Some traders solely use the tape in trading. They make relatively short term trades and allow supply and demand, as displayed on the tape, to dictate their exits and entries.
But it’s not just scalpers that use tape reading. Swing traders, and even some long-term investors, will use the tape to find the best entry and exit points once they’ve identified a longer term trade setup.
Speed of Transactions
Speed is one way traders utilize the tape to forecast future market direction. You can identify momentum by seeing an acceleration of prints in one direction.
For example, you’re watching the tape of Apple stock. Currently, there’s about one order per second being executed. If suddenly, several orders per second are executed on the bid, that can indicate a shift in short-term market dynamics.
Speed of transactions alone won’t give you enough conviction to put on a trade, but when used in conjunction with other indicators, it can serve as confirmation.
Rate of Volume
Most orders in the market are small and inconsequential, trading 100-200 shares per trade. Over the last few decades, this trend has been persisting aggressively due to the rapid rise in algorithmic trading. It’s important not to get too wrapped up in analyzing these prints. All combined, they matter, but there is so much noise in the modern market that your focus is better shifted on the less frequent large orders that really move markets.
When you see you’re seeing a string of small orders, between 100 and 2,000 shares, and you suddenly see an order north of 50,000 shares, that should get your attention. It’s likely to be from a large institution. You have to ask yourself: are they done buying or selling? Will other huge orders come through the market? If so, in what direction?
“Principles of tape reading take you right to the heart of this speculative arena. They match price movement to crowd behavior in the form of a rate of volume.”
- Vadym Graifer, author of Techniques of Tape Reading
Trend of Transactions
A trend is simply a sustained supply and demand imbalance. They happen on all time frames–minute to minute, and decade to decade. On a shorter time frame, there is no better gauge of the market’s current trend then the tape.
Sure, a chart will show you where the market is trading, but the additional context provided by the tape is meat and potatoes on short term frames.
When significant volume is being done on the offer, the market is telling you that buyers are getting aggressive and want to buy that market more than sellers want to sell it. This ties in with paying attention to the large orders on the tape. If large orders are moving the price higher or lower consecutively, that’s showing a supply/demand imbalance that you can take advantage.
By closely watching the trend of these transactions, traders may be able to identify incoming demand earlier than chart readers.
Held Bids and Offers
A held bid is when sellers are aggressively hitting the bid on high volume, but the price won’t break below a certain level, and vice versa for a held offer. These are essentially short term support and resistance levels which can be traded off of.
Place of Execution
When the market is consistently printing on one side of the transcation–the bid or the offer–that’s an indication of a short-term supply or demand imbalance.
A string of green prints is telling you that bulls aren’t willing to wait to buy that market and are willing to pay the spread.
Often times a trend will rear its head through prints before it does in price, this is momentum building.
Tips for Using Time and Sales
Size Filter
Most modern platforms that offer T&S allow you to change settings within it. One of the most important settings is a size filter. Otherwise, the tape will be moving much too fast and will be clogged with tiny orders.
One of the best tape readers of all time agrees that the tape moves too fast nowadays. Billionaire trader Steven Cohen, who started as a tape-reader has said that
“In those days, the tape was so slow that you could follow it. You could see volume coming into a stock and get the sense that it was going higher. You can’t do that nowadays; the tape is far too fast. But everything I do today has its roots in those early tape-reading experiences.”
Cohen told Jack Schwager this in 2001 during his Stock Market Wizards interview. With the rise of HFT and further miniaturization of trade size, you could imagine that it’s even worse now.
This creates the need for size filters. Thinkorswim, for example, makes it quite easy to create a size filter. You simply set the minimum and maximum share count to show up on time & sales. Any orders smaller or larger than that won’t be displayed.
Use The Tape In Conjunction With Other Tools
With the amount of noise present in modern markets, especially on the shorter time frames, tape reading has changed. Traders who spent years only reading the tape have been forced to adapt and take a hybrid approach that includes charts and tape reading.
Many modern traders use chart reading to identify setups, and tape reading for confirmation and entries/exits.
Final Thoughts
It’s clear that tape reading as a discipline has been disrupted by the advent of electronic trading and the following developments that it stemmed. Many who made their living from tape reading were driven out of the trading business post-GFC, citing structural changes to the market.
While tape reading might not be able to generate the alpha it once did, several successful traders still rely on the practice to confirm their trading decisions.
Instead of being the conduit to a trading strategy on its own, it has taken a backseat and instead become a secondary indicator to be used for confirmation.
“Of course there is always a reason for fluctuations, but the tape does not concern itself with the why or wherefore. It doesn’t go into explanations. I didn’t ask the tape why when I was fourteen, and I don’t ask it today at forty…”
- Jesse Livermore in Reminiscences of a Stock Operator