

What’s up, everyone? All right, so here we are, Tuesday morning, another green day, 4,300 bucks. Nothing to complain about there. I mean, it’s continued momentum. The last … well, it’s been that last month or so, has just been really, really hot.
I’m doing about $12,000 a week, so I’m just going to keep that up, because what I’ve learned is that $12,000 a week keeps the real job away. So I’m feeling really excited.
Now, I have something here. This is a gift from YouTube that I’ve been really excited to open, so I figure we’ll open it here, and I’m going to put this on display somewhere in the new office. Let’s see, what they sent us is a … I guess this is something they do for people who have made a lot of videos. Aw, it’s a letter. It appears hand-signed. It’s hard to tell. “You’ve just done something very few YouTube creators accomplish. You had an astounding 100,000 people subscribe to your channel.” We had 200,000 subscribers. I guess they’re a little behind the ball, but I appreciate it nonetheless.
All right, wow, “Presented to Warrior Trading for passing 100,000 subscribers.” This is going to go somewhere right over here. That’s pretty cool, very cool. All right. I wanted to open that. It’s been sitting in this box here for a while, so that’s really cool. 100,000 subscribers. Well, maybe they send another one when you break a quarter million, because we’re coming right up on that real quick.
All right, so anyways, we’ll break down all of today’s trades in today’s midday market recap, and as usual, you guys have any questions, any comments, leave them below. I’ll come back through later today and answer them all. All right, enjoy.
All right, what’s up everyone? We’re going to do our midday market recap, go over the trades from this morning, finishing the day up $4,312.22. It’s another really solid day of trading. This has been a pretty great month. In fact, I haven’t had a green day this month where I haven’t made more than a thousand bucks. My worst green day this month was $1,300, and I’ve had three days that were in the $8,000 range.
So sitting right now up about 37,000 on the month, and we’ve still got two full weeks left to trade. I’m only halfway through the month. So right now I’m tracking for a $70,000 month, I mean, 75,000. But you know, there’s the ebb and the flow. We’ve been on a hot streak now that started in the middle of June, and the last two weeks of June, $22,000 week, $26,000 week.
Opened up, first week of July made 12 grand, second week of July, another 12,000, $13,000, and here we are this week, already up about $12,000. So you know, 12,000 a week, that keeps the job away, right? If I can keep it going, that would be great, but of course, the way trading goes, there’s the ebb and the flow, so I have to anticipate that things will slow down for me at some point, whether that’s going to be a week from now or a month from now, I’ll have to have these profits tide me over when things get slow.
So I haven’t gone and put the deposit out on the Lamborghini. Even though I’ve made some good money in the last month, I’m playing it smart, and for the most part, the profits are building up in my account, but I will take out money soon. I might take out some money at the end of this week. I have a little construction project I’m starting at home this week. Maybe later in the week I’ll come on and show you what I’m working on. So I will take some money out, but trying to play it smart and just enjoy the hot streak while it lasts.
Yeah, so here today I traded six stocks, green on five out of the six. Accuracy is pretty solid, on point there. Biggest winner, CLRB, $2,600. Okay, so CLRB today, I say this every day, but today was no different from any other day. It really wasn’t. It just started the same way, looking at our gap scanners. The goal as a trader is to find stocks to trade every single morning that are going to move, and that for me, when I was getting started, was such a challenge. I wasn’t good at finding stocks to trade, and so what I would do is, as a beginner trader, is I would Google “hot penny stock picks” and stuff like that, and I would just subscribe to like a million different newsletters.
And guess what? I got tons of junk emails, “Today’s hot penny stock pick is XYZ and blah, blah, blah, blah.” You know what? I never made good money trading those. I made a little bit on a couple of trades, and then I lost money on a bunch of them, and I just realized that was not a sustainable way to make a living. I mean, it was just pure luck. I’m sure some of you guys have tried that.
I tried following the guru trade alerts and stuff like that, and I just didn’t have the stomach for it, and the reality was, I would always be buying higher, and so even if it was a winner, my winner was smaller than theirs. And if it was a loser, my loser was bigger than theirs, because I got in at a higher price. That just seems like a small difference, but that small difference meant my winners were smaller, my losers were bigger, and I wasn’t making money following.
So following doesn’t work. Penny stocks don’t work. How are you going to find stocks to trade? And then I discovered this tool, which is the stock scanners that we use every day. This is a game-changer, because this allows me to find stocks in a matter of five minutes. Five minutes each day, I find stocks to trade. This morning, as soon as I pulled it up, these were the three leading gappers: CLRB at $11, AMRH at $2, and GBR at $3.66. Now, CLRB appears that it’s gapping up 1,400%, which is crazy, but it’s not actually gapping up that much.
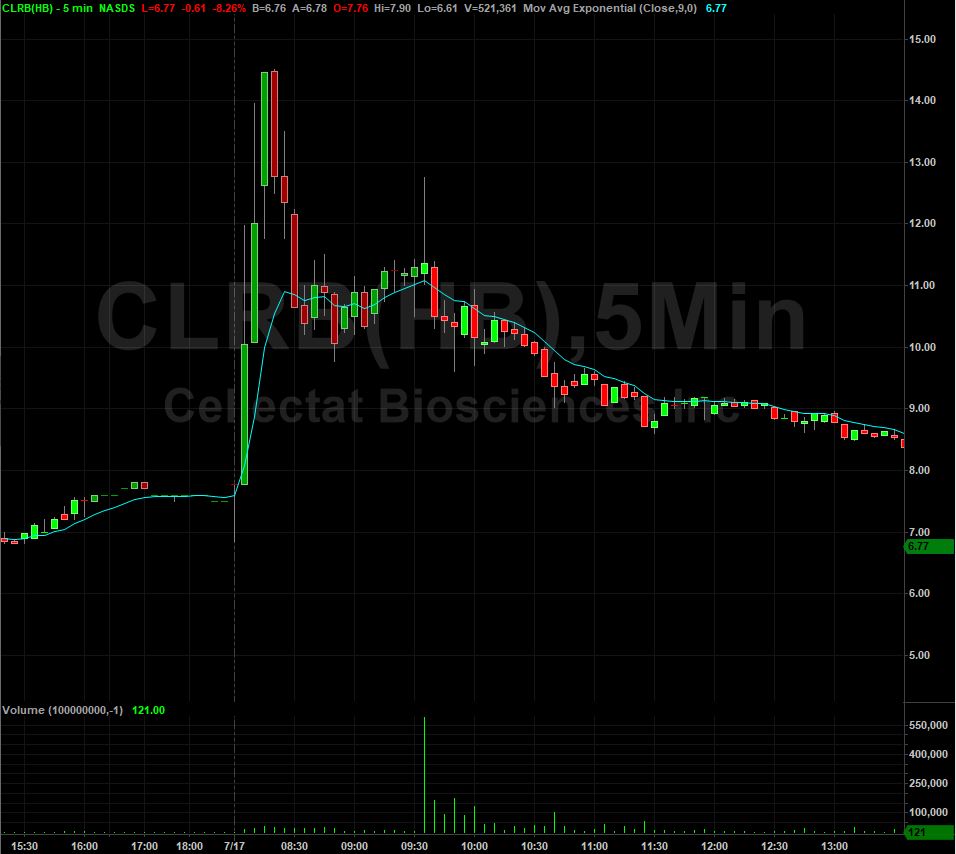
Here’s the deal. CLRB was a reverse split, so when companies do these reverse splits … this was a 10-to-1 reverse split … yesterday this stock was priced at, yesterday it closed at 75 cents per share, so if you were holding 10,000 shares yesterday at 75 cents per share, today, this morning you would have woken up and you would have been holding only 1,000 shares, magically at $7.50. But it wasn’t just at $7.50.
It actually squeezed up pre-market to a high of $14.50, up 100%, which is still good, but it is only 100%. So why was that? Well, here’s the headline. Out at 8 a.m., reports 94% reduction in overall tumor volume in a phase 2 clinical study. This is a biotech stock, and this type of thing can be a real game-changer for a small company. This was the catalyst, so we have two things happening at once. We have a reverse split, and we have a catalyst.
The catalyst is what really allows this thing to start moving. I’m watching it pre-market, over the pre-market pivot of 11.40, which was right here, and then over 11.50, which is the half dollar. So those who are in the Warrior Pro class and have watched chapter six, we talk about the gap and go strategy. One of our setups for the gap and go strategy is to buy a break of the pre-market pivot.
One of the other strategies is to buy a break of half dollars and whole dollars, or a break of the pre-market high. Another strategy is to buy the red-to-green move. In this case, what I did was I was watching for the break over 11.40, so before the bell even rang, I had my order ready to go to buy at 11.40. I was prepped and ready to go.
So let me just show you … let’s see. All right, I actually have, because I’ve been busily working on getting our new round of classes together. Those of you who are hanging out here, you can see, over here I’ve got my PowerPoint, so I’m working on all these classes. This one’s a 79-slide deck, and I’ve got 16 files here. The biggest one is this chapter right here, which is 320 slides. Get ready, guys, this class is going to be crazy. We’ll be teaching it again coming up soon.
Anyways, I’ve been recording a lot of my trades and uploading them the web, and then adding them into these classes, so I can get ready for this next round of live classes. So I was recording the trade on CLBS, and let me open that up so I can just play it for you. CLBS, here we go, let me go full-screen. All right, so CLBS I’m watching. Right now in this video it’s 9:28 a.m. Oh, hold on, I gotta back out of this.
I’ll just go like this, okay. I want to be able to use my drawing tool. So 9:28 a.m., we’re getting ready for the open. Sorry, I keep saying CLBS … CLRB. CLRB right here, we’ve got the pre-market pivot right at 11.40, so I’m going to put my order right around 11.50. I’m reducing share size to 1,500 shares, because this is a little bit of a higher-priced stock. It’s a little outside my go-to price range.
So I’ve got the order ready at 11.50. I’ll just fast forward a teeny bit. As soon as the bell rings, I’m already ready to jump in this thing. I know my price, I know what I’m looking to do, getting in at 11.40-11.50 for a break in the pre-market pivot, first target, half dollar. So I jump in here. Let’s wait for the bell to ring. We’ve got 30 seconds to the bell, fast forward a little bit. All right, 15 seconds to the bell in this video. It’s up 50%, which is accurate. So now what I’m going to do is I’m going to be watching, as soon as the bell rings. A Little dip here, a little selling, so I’m hesitating, I’m not jumping in just yet. The bell has now rung. I’m waiting for it to start surging back up. That means I want to see green on the time and sales right here. That’s called tape reading.
There, I jump in right as it starts to surge up. I only fill part of my order. I guess I’ve got 2,900 shares. I tried to jump in so quickly, I didn’t get all of the orders filled. So I jump in, and just like that, as soon as it pops up, I’m getting in for a break over the half dollar. That’s the setup there. I’m getting in underneath the half dollar. As soon as it’s on the other side of the half dollar, that’s where I take profit. That’s the same thing that I did yesterday on MGLS, jumping in for the half dollar break.
Here in the first four seconds, I’m up 660 bucks. I’m still holding 734 shares. Now, if it holds up here, I’m willing to add more. It dips a little bit, and now boom, I add more, and now I’ve got 3,200 shares, and this is where we pop here up to 12.44. I’ve got 2,200. I try to sell on the ask, but I don’t get filled, so I hit the bid. I sell at 12.15 on the bid, reducing my risk, and just like that I’m up $2,000 in the first 30 seconds of the day, trading a gap and go strategy. It’s a gap and go setup, straight off the watchlist.
This is the difference between following a trader and understanding how to trade these on your own. If I wasn’t here today, every single one of you could have taken this same trade on your own, because you understand the strategy. I had such a hard time as a beginner trader understanding … this trade will continue on, I end up finishing up about $2,600 on that stock. The thing is, when I was trying to figure out when I would get those newsletter email alerts and stuff like that, I was like okay, how are they finding these stocks? I want to be able to learn the strategy, so I want to figure out, how are these people finding the stocks that they’re alerting?
I realized that there was no rhyme or reason. I mean, there was some rhyme, there was some reason, but it wasn’t a strategy that I could replicate. Their strategy was essentially finding a really cheap penny stock and then just sending out an alert. And that only works, it only goes up when you’ve got 100,000 people on your email list that are going to buy after you. That strategy doesn’t work for a regular trader who’s trying to learn, but the gap strategy does work. This works, because in the entire stock market, in the entire US stock market today, these are the top 10 leading gappers, and that means all the traders around the world who look at gap scanners, which is a good portion of them, they’re going to see these three or four stocks.
So CLRB, it was an obvious setup. Now, what’s disappointing is that it only hit 12.76 and then came back down. In contrast, yesterday MDGS broke the pre-market high and squeezed up all the way from the pivot of 6.50 to $9.50. That’s $3 per share, so that’s a really big move. Now, the question is, do you scalp or do you add to the trade? Do you sell and then get back in, or do you just hold the core position? That’s always sort of the challenge. When we’re in a really strong market, I’m more inclined to hold the whole position, looking for it to move into a circuit breaker halt. In the case of CLRB, it’s a higher-priced stock. It’s above my $10 cutoff, so the fact that I’m even trading it, there’s more risk. So in this case I’m going to be much more inclined to take profit quickly and then get back in if it shows strength.
So it’s partly based on price range. It’s partly based on the condition of the overall market. It’s partly based on how much I’m up on the week or even how much I’m up on the day. If I’m already up on the day 4,000 or $5,000, I’m more inclined to take a position and hold it and let it ride, because I’ve got good profit. But at the first 5-10 minutes, I’m much more inclined to get small gains, take the win, and move on to the next one, or get back in if it shows strength.
So anyway, CLRB, 2,600 bucks on that one. That was good. GBR, this one another decent trade here. Initially, I didn’t have a lot of faith in it, I really didn’t. I just don’t really trust the stock all that much after that huge red day a couple weeks ago. But as it starts to curl up, I’m watching it at $4. I’m watching it at 4, it pops up, $4 is on the ask, and I’m saying okay, guys, I’m watching this. This is a momentum strategy. I’m watching it for a break over the whole dollar. Whole dollar and half dollar setups are the same. In this case, let’s see, whole dollar scalp, this is going to go into the class as well. So I was watching GBR here. It’s got 700,000 shares of volume. I’m watching it for a break over $4. I already have my order ready right here at 4.02. I’m watching the time and sales, I want to see all of this buying volume in the green. Let me just turn my drawing tool back on. All this buying is what I want to see.
It had already tapped 4 and pulled back, and so as it came back up, as it’s curling back up here, I want to buy for the break of 4, target is 10 cents. I get in here for the break of 4. I see the volume coming in. See all that green? That’s what starts to give me confidence. People are buying this. And I went from 10,000 shares to 9,000. It’s getting taken down. So boom, that’s where I start pressing the buy button, and just like that, it pops up over the half dollar. This is a scalp trade as well. It’s a break of the half dollar/whole dollar. I’m in at 4, and as soon as it pops up, I always have a 10-cent target on this type of trade.
I take half my profit on the ask at 4.07. I take half my profit up there. It hits 4.08, 4.09, and I’m going to sell more. Squeezing up, there’s 4.10. It’s not opening up as much as I thought, and so I stop out of the rest but just like that, in a matter of seconds, is $472. This is a strategy that you can learn, and you can trade on your own. Here’s the one big problem with this strategy that some people would have an issue with. It’s not scalable.
The reality is, I can’t take one million shares and do what I just did there. I can do 7,500, I can do 10,000, maybe I could do 20,000, but there’s a limit to scalability. So some traders will say, “Ross, if you were really so successful, you took $583, and you’ve turned it into 678,000 or whatever,” some people will say, “I don’t even believe that. If you were really successful, why didn’t you start with 53,000 and turn it into $600 million?”
The problem is, to start with 53,000, to replicate that same growth in my account, I would have to have been trading at points with like 200,000, 300,000, 400,000-share positions, and it’s just not possible. This is a stock that has almost a million shares of volume, which is not bad, but I can’t buy 600,000 shares. So that’s the drawback of this strategy. Full disclosure, you’re not going to be able to make $10 million a year trading this strategy. And you’re not going to be able to, most likely, make $10 million a year day trading large caps. You’re not going to be able to make that much money day trading, because in the period of minutes and hours, there’s not enough liquidity in the market to buy that amount. So that’s the downside.
The upside is that once you master this strategy, once you learn how to get in for half dollar/whole dollar breakouts, once you learn how to trade gap and go stocks, making $100,000 a year or $200,000 a year should not be a challenge. It’s just a matter of mastering the strategy. So there’s an upside limit to how much you can make, and that’s the downside, but there’s also an upside to how much you can make with pretty much any degree.
You’re not going to make $10 million a year as a doctor. I mean, I’m sure there’s a doctor out there who does, but most doctors don’t. So even if you go to school for eight years, you get your PhD and you’re a doctor, your upside earning potential is somewhat capped unless you’re a super-entrepreneur and you create your own practice and blah, blah, blah, blah. But for the majority of people, it’s pretty capped.
And again, there are some people that are going to start day trading, and maybe they will figure out some long-term strategy, and they will, I don’t know, make $10 million a year. But that is the 1% of the 1% of the 1%. It’s just so, so rare. But can you take a small account like 500, 600 bucks and grow it? Absolutely, you can do that. That’s exactly what I did. As of today, this account that I started with $583 is at $687,000. Pretty crazy, right? I started the account about a year and a half ago. The goal is still to hit $1 million this year. I’ve got 312,000 to go.
All right, so CLRB, GBR, those were two fun trades. That’s the bulk of my profit today. These trades on PED, ZZAN, AWX, and NDRA, not as much to say there. Didn’t really work out. Jumped into them off the scanners, didn’t really see good follow-through. AWX, I tried to get in at 3. I screwed up my hotkeys. It popped up to a high of 3.20, but it didn’t hold that level. This stock has a history of popping up and dropping, and we were aware of that, so that made me very quick to get out when it started changing directions, and that’s why I was able to minimize the loss or whatever to just being $25 of profit.
All right. Anyways, that’s kind of it for today. It’s another decent day. We’re coming up at 11:30 right now, and we’ll be back at it again first thing tomorrow morning. Another day, another dollar. 12,000 a week keeps the real job away, so that’s great. So I’m going to write down in my calendar, today is the 129th day of the year, $4,312.22, which is great. No home runs like we had yesterday, but I can grind on $4,000 a day. Today’s the 129th trading day of the year for me, and I’m averaging $2,725 per day. Not bad, although I need to average about $3,000 per day to hit the $1 million goal that I’ve set for the end of this year. So I’m a little bit below what I need to be averaging, by $300. I might come in a little shy. We’ll see. Still have time to catch up and recover if we do come into a hot market in the fall. The market’s pretty hot right now, but you know, I need a couple 80,000 or $100,000 months to really get me there.
So anyways, we’ll see what the market has in store for us, but for any of you guys that are at the beginning of your journey, getting into the markets, this hopefully inspires you. This is what it looks like when you’ve been doing it for years and years and years. You just start making a lot of money. It’s kind of the thing with trading is that you survive until you thrive. If you can just keep your head above water long enough, you’ll learn. That’s the experience that I had, for sure.
I’m not going to say that every single person in the world has the risk tolerance or maybe the aptitude or even the physical ability to trade, but for those that do meet that kind of base requirement, I really think it’s just survive till you thrive. Every day that you’re sitting in the chair watching the markets is another day you’re gaining more experience and learning more about how stocks trade, learning more about how to read level 2, how to read the time and sales, and that’s what it’s about.
So another good day, and we’ll be back at it first thing tomorrow morning. All right, everyone. I’ll see you back at it tomorrow, 9:00-9:15, for our pre-market analysis. All right, see you guys in the morning. If you’re still watching, you must have really enjoyed that video, so why not subscribe and get email alerts any time I upload new content? Remember, when you subscribe, you become a member of the Warrior Trading family.