

The tick index is an important indicator used for determining overbought and oversold conditions for active traders.
It is calculated by taking all the stocks on NYSE that have had an uptick minus all the stocks that had a down tick and then the result is displayed on a chart based on your preferred time frame.
It is a very short-term indicator as it is using data on a tick basis but is useful in finding inefficiencies in the market.
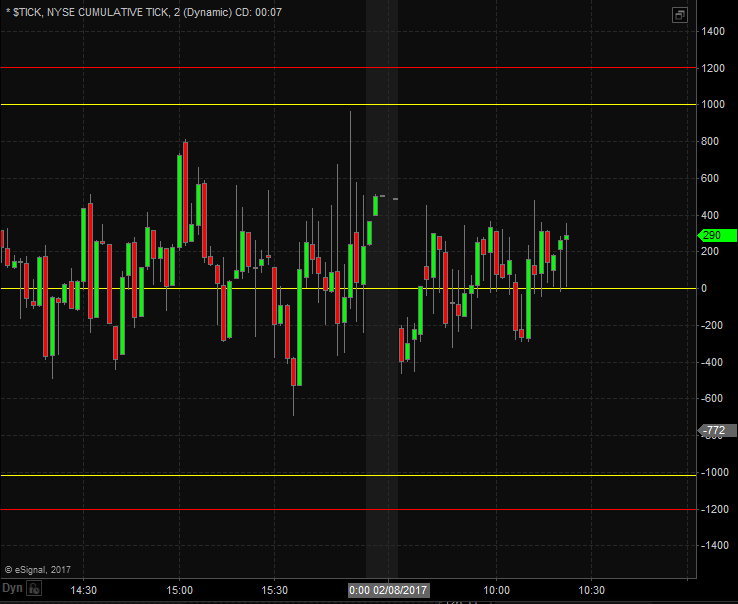
In the above example you can see that I marked off the extreme levels at the top and bottom of the chart with the middle yellow line indicating a neutral market sentiment. When ticks get above 1,000 that means that market sentiment is strong as a majority of stocks are on an uptick and investors and traders are buying.
However, this can be used to an active traders advantage by looking to take a counter trade when these levels hit extremes.
The same can also be said for oversold conditions with ticks get below -1,000 ticks. This indicates that a lot of stocks are getting over sold and that market sentiment is bearish at that moment for whatever reason.
This is a good indicator to watch through out the trading day as it can help confirm price action and signal reversals.
Warrior Trading Pro Tip
One of the best ways to use the tick index is for contrarian plays.
For example, when ticks get above 1,000 or even to 1,200, which is more rare, and align with oscillators like the RSI to reach over bought conditions then there is a high probability that there will be a pullback in the market and you can look to short the SPY or buy puts on it. This is usually best for scalping so be ready to act quickly.