

There are literally thousands of technical indicators you can add to your charts for day trading and investing, but which ones really work?
Below we go over our favorite technical indicators that we use day in and day out to make quick decisions while trading.
Relative Volume
Relative volume compares the current trading volume to the average volume for the same time of day. It is displayed as a ratio.
For example, if a stock is currently trading at 5 times its average volume for that time of day, then the relative volume would be 5.
Relative volume is an indicator of how much action a stock has seen so far that day. A score of less than 1 means that the stock is moving slowly compared to most other days, which indicates that it is not a great candidate for trading on that day.
A score of 2 or more indicates a lot of interest, and means that there is a good chance for a significant price move which is what day trader want. You can also use relative volume to help you determine the size of your position.
The higher the relative volume, the more “in-play” a stock is and the greater the chance of a significant move.
Time & Sales
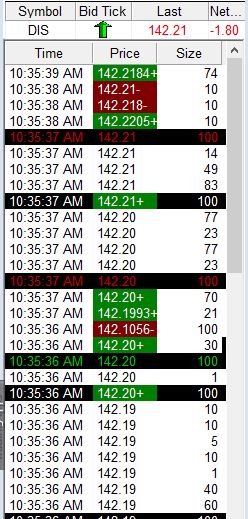
Time and sales is an indicator that displays all the trades that have been executed, along with the time and size of each trade.
A green print indicates a trade executing on the ask price, and a red print indicates a trade executing at the bid price. White prints are for trades that cleared between the bid and ask.
Time and sales shows the number of shares being executed at which price, which offers insight into the current aggressiveness of traders. This indicator is excellent for helping you to choose entry and exit points for each trade and identifying likely pivots in price.
You will often notice a swift acceleration of trading volumes as you approach likely pivot points, which means that there is a good chance that prices will quickly reverse.
It takes a bit of practice to get a feel for using the time and sales indicator, but it is an essential component of any informed trade.
Volume Weighted Average Price
Volume weighted average price, or VWAP, is a technical indicator calculated by finding the total value of all shares bought in a day (each share traded multiplied by the price of the trade), and then dividing that number by the total number of shares traded that day.
The result is an average price based on the weight of volumes traded at different prices.
This indicator is ideal for identifying good prices to enter and exit a position. The opening and closing prices of a stock may be a poor indicator of the true demand and supply for that security.
VWAP helps to bring additional context to a stock’s price by showing the average price where significant trades are actually being made.
Level 2
Level 1 indicators is the current bid/ask quote for a stock. Going one step further, Level 2 displays price quotes at each price level and the name of the market maker that is holding the order.
It is crucial to remember that every disappearing order does not indicate that it was necessarily filled. Market makers can pull their orders at any time, and Level 2 just displays open orders.
The information that Level 2 provides is very important for every trade. This information allows you to identify points of significant price support that the simple bid/ask spread provides no indication of.
In essence, Level 2 allows a preview of the kind of trade volume that you can expect at different prices as the bid/ask spread moves into that price region.
Bottom Line
This of course is not the only indicators that work, they are just the ones that have been proven to work for us over our years of successful day trading.
If you’re working on a new strategy and want to test out some different technical indicators then make sure to do it in a simulator until you can prove that it is profitable.