

The Awesome Oscillator (AO) is one of the most popular indicators that are used to measure momentum in the stock and commodity markets.
It was developed by Bill Williams, a famous charting enthusiast and technical analyst who approached the markets on a psychological level.
In this article, we will detail the calculations used to compile the Awesome Oscillator to then move on to applying the indicator in practice.
We are also going to look at how the AO is different from other oscillators, as well as key trading strategies involving the indicator.
What is the Awesome Oscillator?
By its simplest definition, the Awesome Oscillator (AO) is a market momentum indicator that compares recent market movements to past market movements to gauge whether bullish or bearish forces are currently driving the market.
Similar to the Moving Average Convergence Divergence (MACD) indicator, the AO indicator histogram displays the market momentum of a recent number of periods compared to the momentum of a larger number of previous periods.
This indicator uses a zero line in the centre, either side of which price movements are plotted according to a comparison of two different moving averages.
How it is calculated
The AO histogram is a 34-period simple moving average that is plotted through the midpoints of the bars (H+L)/2, and subtracted from the 5-period simple moving average, graphed across the midpoints of the bars (H+L)/2.
Awesome Oscillator = SMA (MEDIAN PRICE, 5 PERIODS) – SMA (MEDIAN PRICE, 34 PERIODS)
Where Median Price = (H+L)/2,
SMA = Simple Moving Average
H = The highest price of the bars
L = The lowest price of the bars
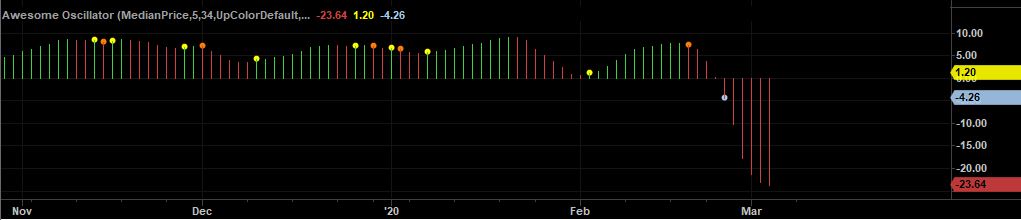
In most of the graphs, momentum is classified and indicated in respect of the color of the bars.
Green bars indicate that momentum is higher than the previous, showing upward momentum, while red bars indicate that it’s lower than the previous, showing downward momentum.
How the Awesome Oscillator is different from MACD
Awesome oscillator and MACD are both technical analysis indicators that are used to provide signals for potential trend direction, trend reversal or exit and entry alerts by analyzing the strength or weakness of a security.
However, there are differences in the way the two indicators appear on the chart and how they are calculated:
- Awesome oscillator uses the 34-period and 5-period simple moving average while the MACD indicator uses 26-period and 12-period exponential moving averages along with the 9-period signal line.
- AO calculations are based on the median price while the MACD is calculated using the closing price.
The MACD is calculated as follows:
MACD Line = 12day EMA – 26day EMA
Signal Line = 9day EMA of MACD Line
Where EMA is exponential moving average
The MACD Histogram is the MACD Line – Signal Line
Trading strategies with Awesome Oscillator
AO indicator provides a number of signals that help to predict corrections and reversals of the price. This indicator works under the premise that as momentum begins to slow, fewer sellers or fewer buyers are willing to trade at the current price.
- Zero line crossover

The simplest way to interpret the AO is to observe when the bar goes through the zero line. This indicator fluctuates between bullish momentum when trading above the zero line and bearish momentum when trading below the zero line.
If the AO histogram crosses above the zero line, that is indicative of bearish momentum. Conversely, when it is crossing below, that is indicative of bearish momentum.
Buy signal: This signal is generated when the bar chart crosses above the zero line. The implies that the price of the stock is reversing course, either by breaking out above recent highs or having bottomed out. This is typically viewed as a bullish signal.
Sell signal: This signal comes when the bar chart crosses below the zero line. This can generally mean that the price of the stock has broken below recent lows, or topped out and is reversing. Traders often interpret these events as bearish signals.
- Divergence
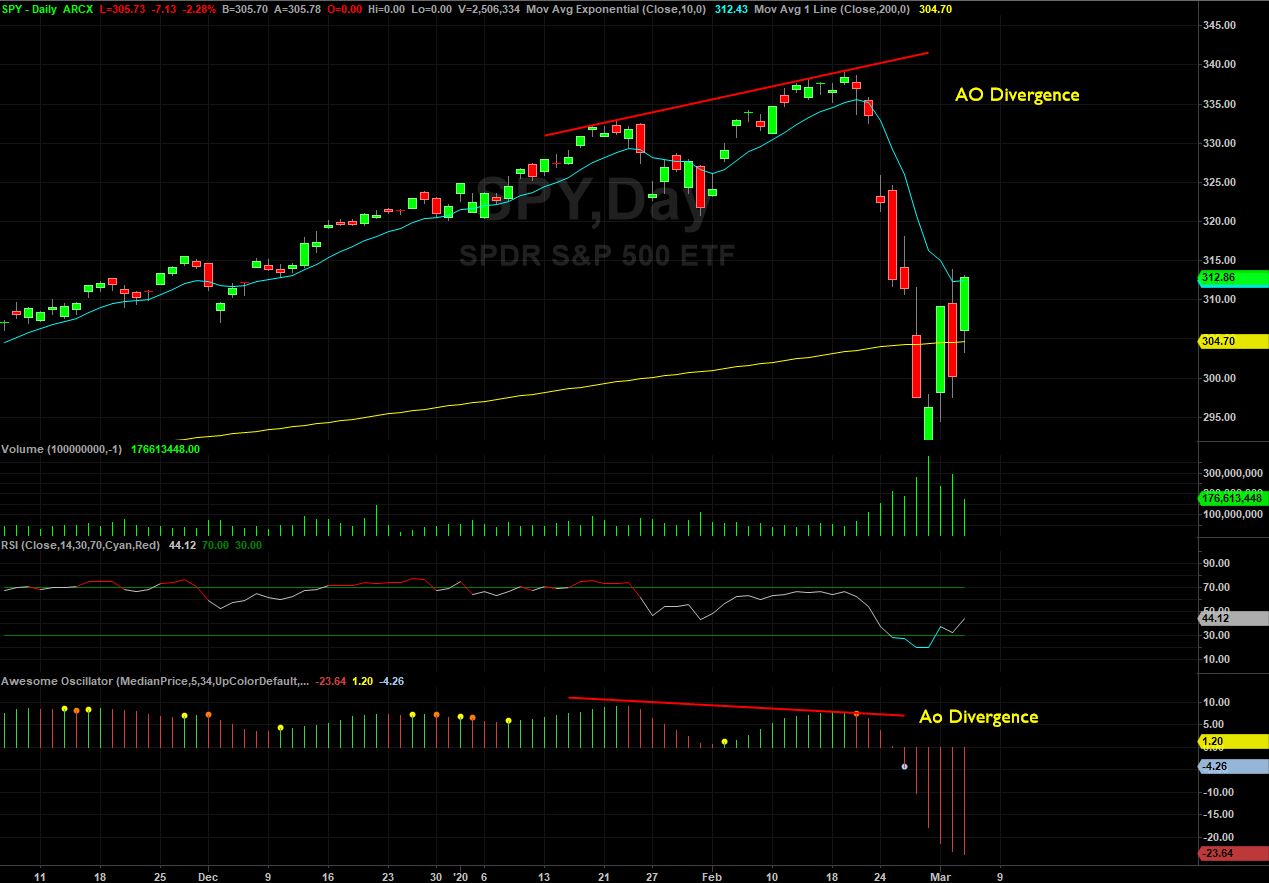
Another advantage of the awesome oscillator is its usage in determining divergence.
In day trading, divergence is simply when price of a security is moving in one direction and an oscillating indicator is moving in the opposite direction. In short, if you see the price of a security going up and making new higher highs, but the AO is making new lower highs, you have a divergence.
Identifying divergences between technical indicators and price is a crucial aspect of technical trading.
Bearish divergencies might signal that prices are likely to correct and that it might be advisable to exit long positions; similarly, bullish divergences could signal a trader to exit any shorts.
However, just because you see a divergence does not necessarily mean that you should reverse your stock trades. Divergences are commonly used as warnings of a potential reversal in trend instead of continuation.
Bottom Line
The most successful day traders are the ones who have developed an edge, and this is where profitable stock trading strategies and simple market analysis come into play. The Awesome oscillator is one of the best momentum indicators that you can rely on for amazing results.
This oscillator shows us quite clearly what is happening to the market driving force in the present moment. It is a great momentum indicator that can be applied across different styles of trading, including day trading, scalping, and swing trading.
If interpreted and used wisely, it will help you know whether it is an ideal time to go short or long, or close your opened trades.