

Technical analysis can’t get complicated really quickly so we put together some of the best indicators for day trading and how you can use them.
What is Technical Analysis?
To understand what technical indicators are, you should first know what Technical Analysis is – and who the people who practice it are.
Traditional financial analysis is related to the basic study of economics: supply and demand.
Fundamental Analysts look at various pieces of data and reports to determine what factors will contribute to an instrument’s future price.
Technical Analysts don’t care about all of the factors – they care about the market’s moves. Price action is king as a technical analyst.
Efficient Market Hypothesis
Broadly speaking, the EMH tells traders and investors that all known and unknown data is priced into the price of a stock, index, currency, etc., and therefore the current price is always the best deal.
Adherents to the EMH believe that we are unable to determine future price action based on past price behavior, which is ridiculous.
All of behavioral science and the study of human activity predicts future behavior based on past behavior. Analyzing past behavior and trends is something scientists do in multiple fields on a daily basis.
So, the idea that we can’t predict the future price action of a stock based on its historical price action is just silly.
Technical analysts are concerned with the chart and price alone – nothing else matters. To study price and its behavior, technical analysts use technical indicators.
And there are a metric ton of technical indicators out there.
Some of the available technical analysis tools boggle the mind and seem like magic; others are just weird.
Technical Indicator Example
Do you know there is one technical indicator created because the Episcopal Church asked a parishioner to find good investment opportunities? True story.
Also, it was the early 1960s. The indicator is called the Coppock Curve.
The man who created it (Edwin Coppock, an economist) thought when people experienced a big loss in the stock market that it must be similar to grieving and losing a loved one.
He polled the Episcopal Bishops to find how long it took for people to overcome the loss.
The result? Eleven to fourteen months.
He took that data, applied a Weighted Moving Average (WMA) of the Rate Of Change of the eleven and fourteen-month periods, and voila, we have a technical indicator. And for the stock market, it’s creepily effective on a monthly time frame.
The Coppock Curve is just an example of a technical indicator. But what are technical indicators? They are visual representations of data placed on a stock chart. Think of a line chart of a pie chart used in a PowerPoint, how is the line or pie chart formed? By using input data.
Technical indicators are the same way and measure all sorts of different data to give the trader/analyst the ability to forecast future price action.
Some technical indicators we use on fast time frames, some we use on slow time frames, some can we use on any time frame, and some require zero time at all.
For day traders – specifically, those of you who trade on crazy-fast timeframes under one-hour, you need a special toolbox of indicators to help you quickly interpret price behavior and to capitalize on changes as they happen.
Why Day Traders Use Technical Indicators?
Day traders use technical indicators out of necessity. There is absolutely no way to make money on fast time frames with just fundamental data. As traders, we must use tools that display price action and market data to help us form analysis that will determine profitably.
So how do indicators help you become profitable? Which ones do you even pick? There are roughly four-thousand technical indicators out there.
For markets that have fixed volumes like the stock market, few indicators are as useful or powerful as volume.
But others compliment volume – we’re going to look at some of those indicators later in this article.
Best Indicators for Day Trading
Below are three important indicators for day trading but keep in mind that there are a ton of indicators out there. Some that you might find to be very helpful in your day trading.
So make sure to test out new indicators and see how they perform, but do it in a simulator! No point in risking real money if you don’t know how to use the indicator or if turns out it’s not very reliable.
Indicator #1: Volume

Volume is truth. Volume is honesty. Volume tells us what is happening. Of all the technical indicators that exist, volume is perhaps the most used and most familiar to even new traders and investors.
Volume also has its sub-type of study in technical analysis known as, get ready for it: Volume Analysis. The image below shows an example of what to look for with volume.
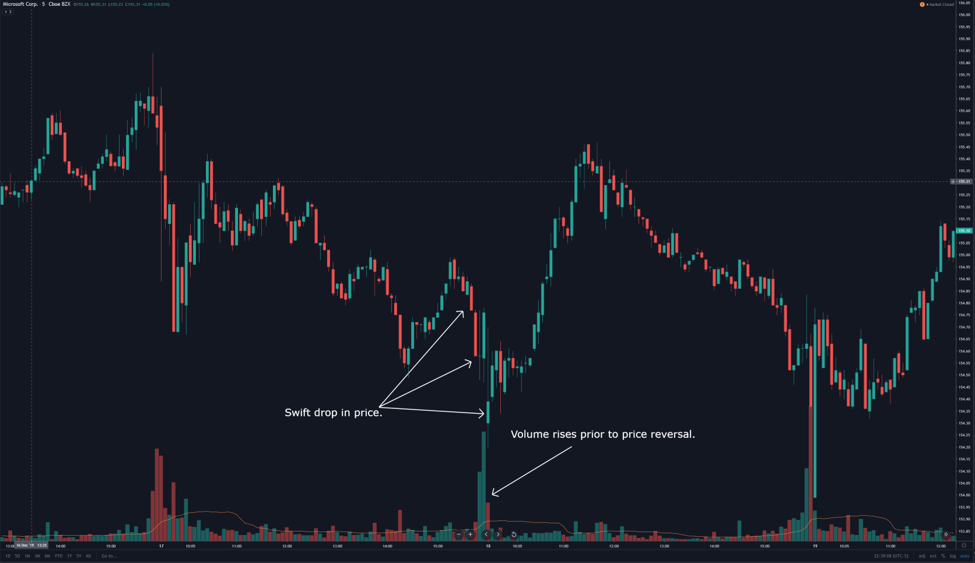
The maxim: “Volume precedes price” is popular for a good reason. For the stock market, when we price dropping or trending lower and volume begins to increase, this is often a signal that a bounce is incoming.
Indicator #2: Volume Weighted Average Price
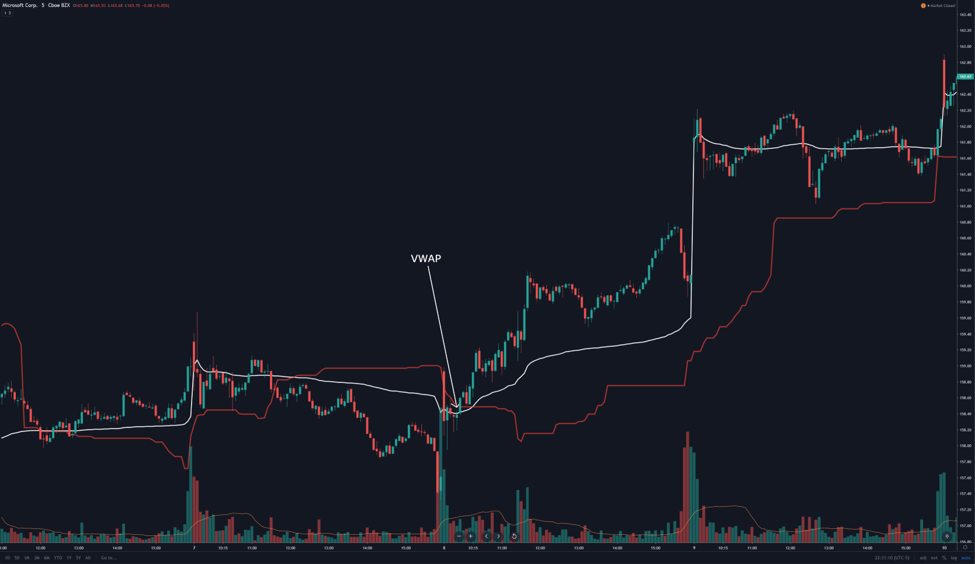
Behold the bread and butter indicator for many day traders: The VWAP. The VWAP (volume weighted average price) is a powerful indicator and one of the few indicators that is almost entirely intended for day trading.
While it looks like a normal moving average (and it is a moving average), it is an entirely different beast than a normal moving average.

Like many moving average trading strategies, the most common strategies with the VWAP involve price crossing the VWAP line. Aggressive buyers will often take the initial breakout above the VWAP.
Conservative buyers will wait for a retest of the VWAP as support, or a false return lower.
Indicator #3: Senkou Span B

If you have no idea what Senkou Span B is, that’s fine. The Senkou Span B is part of the Ichimoku Kinko Hyo trading system. Oddly enough, the entire trading system is now a common and default indicator in many charting software packages.
Senkou Span B is a moving average, but not in the same manner as a simple moving average or exponential moving average.
Japanese technical analysis focuses on the concept of equilibrium. Senkou Span B is a perfect example of that concept. Senkou Span B is calculated by adding the highest high and lowest low of the past 52-periods and then dividing it by 2.
We then take that value and plot it ahead 26 periods. The Ichimoku Kinko Hyo system is one of the few systems that attempt to create a leading indicator out of lagging data.
The only component of the Ichimoku system that I include to use in concert with the VWAP and Volume indicators is the Senkou Span B. The reason for this is simple: in the Ichimoku system, Senkou Span B is the single most challenging level to break.
Pro tip: if you spot the Senkou Span B creating flat levels, take note. Flat levels of Senkou Span B exacerbate the strength of its support/resistance. Don’t be surprised if you find price getting rejected against flat levels of the Senkou Span B – but don’t surprised when price moves violent and swiftly through those zones.
Putting it All Together
It is now time to put the Volume, VWAP, and Senkou Span B indicators together to create a trading strategy.
The Senkou Span B filters the trade direction.
- If price is above Senkou Span B, we only take long trades.
- If price is below Senkou Span B, we only take short trades.
The Volume indicator filters for stocks in play so we know a lot of traders are watching.
- Volume should not be less than 50% of the past 20-period volume average.
The VWAP indicator is our trigger.
- We go long when price closes above the VWAP.
- We go short when price is below the VWAP.
There are some options conditions that you could apply. The first option requires that the VWAP be above Senkou Span B for long trades and below Senkou Span B for short trades.
Another option would be no trades should be entered if price is trading at an extreme from the VWAP.
Let’s look at some past price action and do a walkthrough. The example below is all done using recent price data and does not represent the actual trading that would occur during a live trade.
While the example does show the ideal conditions for the strategies we discuss, live trading is always a different ball game.

The above chart is Microsoft’s 5-minute chart. The red average is Senkou Span B, and the white average is the session VWAP.
Step One: Identify where price is in relation to Senkou Span B to filter the trade direction.
For the January 22nd, 2020 trade session, MSFT opened the trading day below Senkou Span B. That means we only take short trades. Next step.
Step Two: Identify if volume is appropriate.
The current volume should not be less than 50% of the two-period average. The reason we filter for appropriate volume is due to the risk of increased volatility and stops getting hit.
We also want to make sure there is enough participation in the market. Looking at the open of January 22nd’s market, volume is more than appropriate. Next step.
Step Three: Entries occur at the cross of the VWAP.

Style of trading and risk tolerance are significant factors of any trading system. By its very nature, the 5-minute chart is an inherently volatile and risky timeframe. You are apt to see frequent whipsaws and fakeouts.
For that reason, when I trade on faster timeframes, I like to take the conservative entry approach. Step One and Step Two both give the ok for taking a short trade.
The conservative entry is when price closes below the VWAP the second time. The first candle closes below the VWAP, but I am not entering at the initial break. The next candle moves higher and closes above the VWAP. The third candle is the entry.
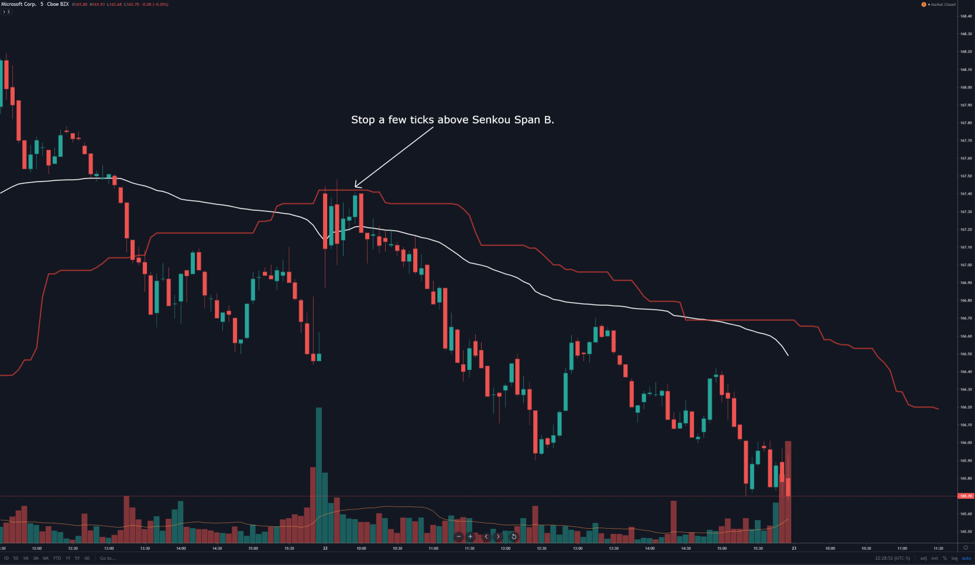
How long do we hold onto the trade? Profit targets are a very personal and individualized target – but the placement of the stop is easy. For nearly every trade with this strategy, Senkou Span B is the stop. Because we’ve taken the short side of Microsoft’s chart, the stop would be a few ticks above Senkou Span B.
For those who are countertrend traders, there are ample opportunities for you to trade. The countertrend strategy primarily involves the VWAP. Using the same chart above, observe how far price has moved away from the VWAP before retracing some or all of the space between price and the VWAP.
If you measure some of the maximum moves away from the VWAP and average those moves, we can get an idea of the limits price will move. For the countertrend trader, trading the extreme moves away from the VWAP should also have high volume levels trading at those extremes.
Caution should be maintained though – trading against the trend is very, very risky.
Long and short trade checklist cheat sheet

Wrapping up the Best Indicators for Day Trading
One of the most significant hurdles in trading is not just finding the indicators that are going to be the most useful to you but making sure you don’t use too many. A high number of new traders end up adding too many indicators on their charts. 2 or 3 should be all you have.
I believe that Volume, VWAP and Senkou Span B provide an excellent combination of indicators to help your trading.
Using the Senkou Span B to filter our directional bias automatically provides for a powerful and accurate tool. The volume indicator further increases the profitability potential of a trade by making sure volume is appropriate.
Finally, the VWAP creates the day trading entry tool that we need for our short term trading.
With any trading system, there is always in risk. This is especially true in fast time frames.
Before you trade any system live, you should make sure that you have a risk management plan and have practiced paper trading first.
As always, trade smart, trade safe and trade with confidence.