

Out of all the chart patterns that we like to see in a bull market, the falling wedge is definitely one of the top patterns for new traders. It’s an extremely bullish pattern for all instruments in any market in any trend.
Depending on the educator and educational material you’ve read on chart patterns, wedge patterns may or may not be considered a triangle pattern.
Wedges are a variation of a triangle in that it’s shape ultimately creates an apex (which is very, very far away), but wedges trade very differently than standard triangle patterns.
Understanding how and why the falling wedge pattern forms are essential to learning how to trade it.
Falling Wedge – What is it?
While wedges are also triangles, the difference between a wedge pattern and a triangle pattern is the with the trendlines. Symmetrical triangles have an uptrend and downtrend line of near equal slopes.
An ascending triangle has a flat top with rising bottoms or a rising trendline. A descending triangle has a flat bottom with lower highs or a declining trendline. Wedge patterns have trendlines that both go in the same direction.
On a candlestick chart, a falling wedge is a powerful move lower because there are lower highs and lower lows. You might be wondering, is a falling wedge bearish?
No!
A falling wedge is a very powerful bullish pattern. Below are some common conditions that occur in the market that generate a falling wedge pattern.
- Falling wedges often form after the climax of a violent and fast bearish move.
- Falling wedges often form at the end of a bear move and generate the confirmation swing higher low.
In Kirkpatrick and Dalquist’s Technical Analysis, they write that the failure rate for the falling wedge is considerably low. The failure rate for an upwards breakout is only 8% – 11%. The rarer breakout lower has a much higher failure rate of 15% – 24%.
Don’t quote me on this, but I believe that those results are based solely on the performance in the stock market. The performance level of patterns is going to vary from one market to another.
This is especially true in markets where shorting is easier (Futures, Forex) and more common than in traditional fixed-volume equity markets.
Falling Wedge Breakout
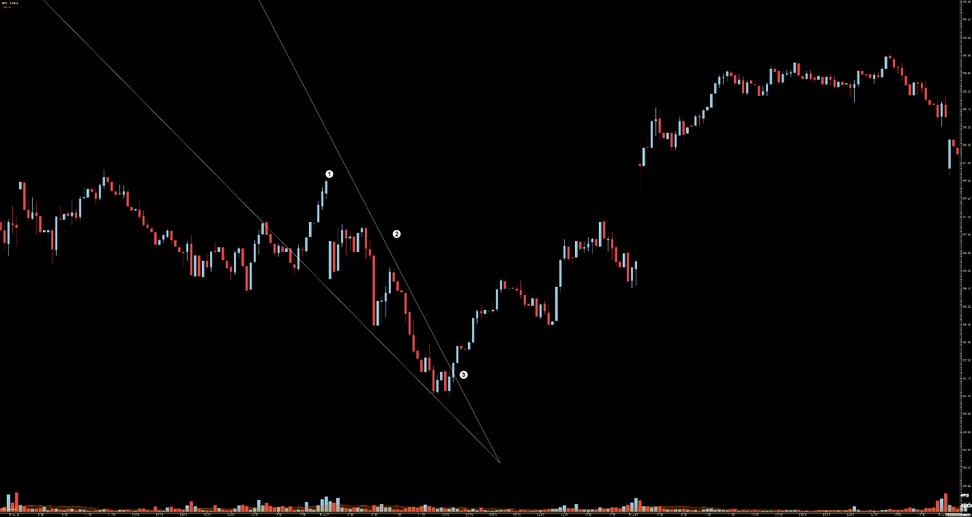
The image above is a 5-minute chart of the SPY. Notice the climax and spike higher that preceded the sharp drop (1). Then we see a sort of paradoxical event that is singular to the falling wedge – falling but consolidating price action.
The behavior of ‘falling buy consolidating’ is easier to understand if you think of taking a ping pong ball and dropping it on the table. The first bounce is very pronounced buy each successive bounce is smaller.
As price moves beyond the downtrend angle, observe how fast price breaks out higher (3).
Psychology Behind Wedge Pattern
There is a psychological component to this pattern as well. The falling wedge causes traders who are long and mostly new to capitulate and sell. This pattern also attracts new traders who want to short.
It’s a particularly nasty pattern for new traders who are unfamiliar with it because it plays with the emotions of both sides of the market. Traders who have long experienced some initial reprieve and hope that the first bounce means a return to higher highs – except the opposite occurs: lower highs.
This causes bulls to abandon their positions and the rate of their selling increases due to the speed of the drop in price. Then, this draws in new traders who have wanted to short but were waiting for some critical level or levels to break.
They realize, too late, that prices are falling and falling fast. New shorts enter because they fear missing out on the sell-off. Then what happens? A pause. The bulls have left and are already hurt; no one wants to buy right away after a series of lower highs and lower lows.
And the traders who took the short side of the market are now concerned because the move down has seemingly stopped – they’re anxious and nervous.

One of the time tested and true ways to trade on a candlestick chart is continuation patterns.
You may or may not be familiar with flags and pennants, but they are common names given to the patterns that show up in bull markets and bear markets.
Flags and pennants let traders know that a resumption of the prior move is about to continue. The falling wedge is a pennant.
We call them flags and pennants because of what they look like. The chart above is Tesla’s (TSLA) 1-hour chart. The prior uptrend is like a pole, and the falling wedge is the pennant ‘waving’ on the pole.
You may notice that the wedge pattern looks more like a channel – this is not uncommon.
Trading the Falling Wedge
Now we come to the bread and butter of the article – how to trade the falling wedge. In prior articles, we’ve reviewed triangle patterns and how to trade those patterns. With triangle patterns (ascending, descending, and symmetrical), there are several entry options available.
When I trade triangle patterns, I like to wait for the break of the second to last swing high or on the retest of the breakout. I have never been a big fan of trading the breakout of a triangle on a candlestick chart.
Wedges are different. I think Kirkpatrick’s and Dalquists own words describe what you should do better than I could:
“It pays to wait for that breakout and to act immediately on it. In addition, because wedges have such a high percentage of breakouts in the direction opposite from the wedge direction, the direction of the breakout is clear once the wedge is forming. A rising wedge invariably will break downward, and a declining wedge upward. Whenever a climax has occurred, whether up or down, look for a wedge to form on the test. This is one of the most profitable patterns of all. Just be sure the wedge as described previously is valid before you take any action.” (Technical Analysis 357).
So that’s easy, right? The entry is the easy part: enter at the breakout of the wedge. But how do you identify a stop or profit target?
Trade Management
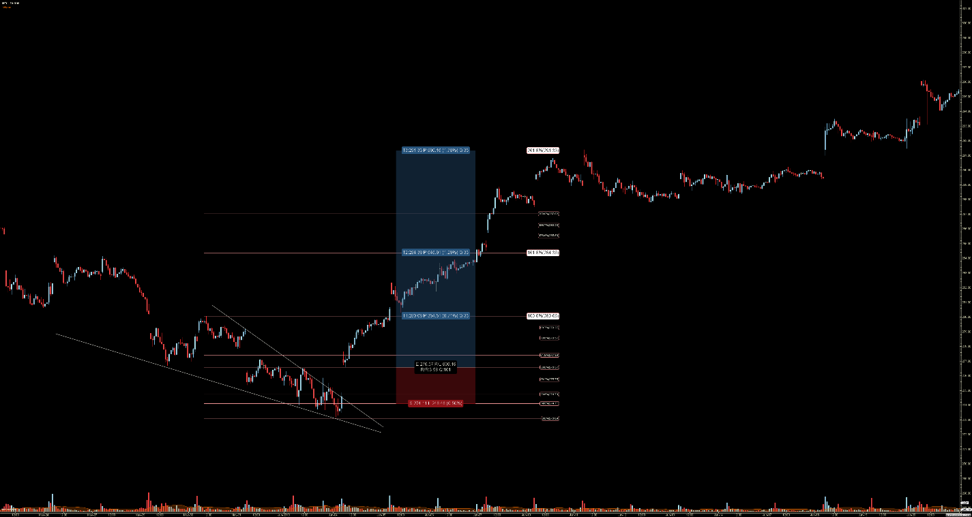
Above is a 15-minute chart of the SPY. We’re looking at the wedge that formed from May 29th, 2019 to June 4th, 2019. We’ve already established that the entry is on the breakout of the wedge.
Notice that the SPY gapped up higher above the wedge. You will find that this is a common occurrence when trading stocks: gaps up/down of patterns is common. So our entry is at 276.57.
But how do we find profit, or where do you place our stops?
One way is with Fibonacci extensions.
For new traders/investors, one of the more difficult things to do is taking profit. Not just taking profit but identifying what your profit target should be. Because of a behavioral defense mechanism known as loss aversion, humans do the opposite of what we should do in trading.
New traders hold on to losers way too long and cut their winners out too soon. It seems so easy to do, but in practice, it’s very hard. We hold on to losers because we don’t want to lose our money, we hope prices will return to at least a level for a break-even trade.
And we get rid of our winners too soon because we become overly protective of the profit that was generated. It’s a vicious and natural response that is very difficult to overcome!
The stop can be made at one of two places. The first option for a stop is below the wedge, which would be around 272. The second stop is at the retest of the breakout. Profit targets can be identified by using a Fibonacci extension tool.
Fibonacci extensions provide future Fibonacci levels based on a user-selected range. For the chart above, the range is swing low at 273.09 to the high of the wedge at 280.06. I like to split my trades up into three or four profit targets.
I do this because I like to take some profit off the table as something moves further into profit – I hate having only one position with one profit target, which is too limiting. The nice thing about the Fibonacci extension tool is that it basically gives you your profit targets.
You can see the three profit targets on the chart. The first is the return to the high of the wedge at 280.006.
The second profit target is the powerful 161.8% Fibonacci extension. Usually, we see a little pause in price action at the 161.8% level, but the SPY just blasted through that zone.
That brings us to the third and final profit target at the 261.8% Fibonacci level at 291.33. The 261.8% level held and then consolidated for another seven days before breaking out higher.
The Risk/Reward for this trade would have been 3.58/1 – a very excellent trading opportunity.
Bottom Line
The falling wedge pattern is a setup you want to understand because of the great risk/reward potential. They can be traded on both short and long term time frames and offer defined entry and exit points.
If you have any questions make sure to leave them in the comment section below!