

Ascending triangle, descending triangle, head-and-shoulders, flag, pennant, cup-and-handle – all of these titles are chart patterns. And that isn’t even all of them!
In the Encylopedia of Chart Patterns by the great Thomas Bulkowski (by far the leading expert in chart patterns), he identifies over fifty different chart patterns.
In Technical Analysis, chart patterns are one of the primary ways that traders and investors find suitable entries. Patterns exist in every market and in every time frame. Even on charts where there is no time component (Point & Figure, Renko), we can still find patterns.
Why do people look for patterns?
Because specific patterns in certain markets have an extremely high positive expectancy rate of becoming profitable. For example, in a bull market, we want to identify a pattern known as a bull flag.
A bull flag is a continuation pattern that gives a precise and conservative re-entry higher. Patterns also have a psychological component involved. Knowing how to identify a pattern and the psychology behind why a particular pattern form is key to taking advantage of trading any pattern.
A quick note on chart patterns: You should be aware that the rate of positive expectancy for any pattern will change depending on the market you primarily trade. Almost all of the professional analysis on chart patterns has been done in traditional equity markets.
When we’ve had a bull market that is pushing into 11 years in length, bearish patterns are understandably going to underperform in the stock market compared to bullish patterns.
You will find that bearish patterns have a much higher rate of success in Forex markets compared to long-biased markets like the stock market.
The Descending Triangle Pattern
In the paragraph above, I wrote about specific patterns operating differently depending on the market you trade.
The Descending Triangle Pattern is an excellent example of different results in different markets. In Forex, the Descending Triangle Pattern is an overwhelmingly bearish pattern – it is one of the most sought out shorting patterns in Forex.
For the stock market, Bulkowski has a total inverse performance to Forex for the descending triangle.
In fact, the performance rate for the descending triangle pattern on a break higher is an astonishing 55 out of 59.
The bearish performance rating in the stock market is a dismal and laughable 9 out of 57.

But what is the descending triangle?
Observe below:
The Descending Triangle Pattern is made up of two trendlines. One horizontal trendline and one descending trend line. Another way to say it is: ‘flat bottoms, falling tops.’ Like all triangle patterns, the descending triangle pattern indicates congestion and indecision.
Trading ranges continue to constrict and whipsaw traders. The Descending Triangle Pattern has some key characteristics:
- The pattern can form in any trend.
- Price should, ideally, touch both the horizontal and descending trendlines at least three times. At least one of the trendlines must be touched three times.
- Volume tends to drop off prior to a breakout.
- Price will generally break out in the final 1/3rd of the descending triangle.
Why this pattern develops

Because a chart is nothing more than a visual representation of the psychology of the participants, its essential to understand the mindset of traders in investors, you need to put yourself into the shoes of someone who is both a bull and a bear with this pattern.
For bulls, they feel supported in their belief that prices will continue to move higher. Why? Because of the continued support that is found at the horizontal trend line. The longer the support level holds, the stronger it becomes.
Additionally, the prior trend was an uptrend so this descending triangle pattern also qualifies as a bearish continuation pattern known as a bullish pennant (pennants make up all triangle patterns).
Bulls are not as concerned about lower highs as they are about the support level remaining stable. A bullish trader is likely to when price closes above the upper trend line.
On the bear side of things, bears find this pattern very desirable. People who are bearish see evidence of a further breakdown as a very high probability due to the continued selling pressure above creating lower highs.
Bulls vs Bears
Bears believe bulls are losing momentum.
Bears also believe that the more frequently the support level is tested, the more likely bullish traders will stop participating, and bears can finally push through. Bears can also fall on the falling volume as an indication of no buyers and thereby believing that they can push prices lower without much resistance.
While both bulls and bears may have biases that support their positions and decisions, we know that new traders and investors can be easily swayed to another side of the market without a lot of difficulties.
That is ultimately why consolidation patterns like the descending triangle form: indecision. The bull trader may very well believe that things are looking bullish until he finally capitulates and gets out of the market. That is one less participant.
The bearish trader may become concerned that the support levels that keep getting tested are not breaking and as the lower highs converge on the support zones, they may cover their shorts and wait it out.
That is another participant out of the market. As participants in the market leave and as new participants wait to see what happens, the volume drops off.
Depending on what Levels of the order book you have access to, check how many resting buy orders are above and how many shorts are below the descending triangle.
How to trade the Descending Triangle Pattern
The chart above is Tesla’s (TSLA) 15-minute chart. When trading a descending triangle pattern, I first want to determine what the overall trend was prior to the pattern. If I were to zoom out, I would see that the trend was overwhelmingly bullish.
That will naturally put me in a position to determine where the likely trade direction will be. Second, I want to observe what volume is doing as we get closer to the apex of the descending triangle. Is volume rising? Is it decreasing? I can see that it is falling. The drop in volume is noticeable both in the volume bars and in the down-trending 20-period volume moving average (A.).
Pro tip: If you notice a drop in volume in any consolidation pattern, that is like a big sign that says, “HEADS UP, BIG MOVE INCOMING.” This is especially true with any triangle pattern.
After I’ve established there is a descending triangle and volume has been decreasing, I need to identify the entry point. Now, you’ll find all sorts of suggestions out there on where you should enter.
Some say enter on the close of the first candlesticks that closes above the trendline; others say wait for a retest of the breakout. For a breakout above the pattern, I look for a break of the second-highest high (B.).
The reason that I don’t like to enter on the immediate break of the trendline or the first close is that there is a greater than 60% chance that there will make a retest of the initial break.
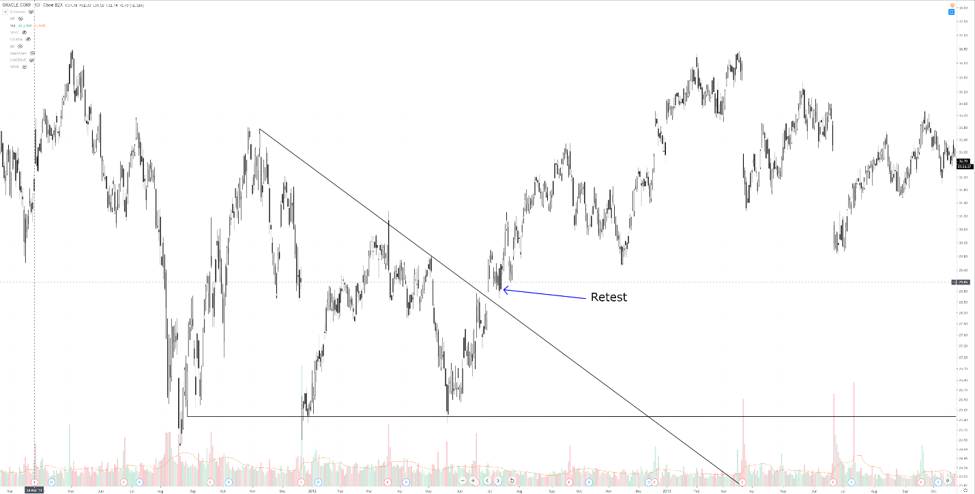
The image above is the daily chart for Oracle (ORCL). One of the more aggressive, but safer entries is on the retest of the initial break. You can see that a clear gap up occurred and initiated the break of the descending triangle.
Then prices moved lower and began to retrace. A very common strategy that traders employ is to wait for the retest of the break. This is known as a confirmation test. When we wait for the retest, we are looking for truth.
The question we should as ourselves is: “Is this a legitimate break?” When prices moves back to test the breakout, it’s the final opportunity for bulls and bears to determine the direction of the trade. Bulls need to show conviction by supporting prices and buying the dip.
Bears need to prove the break is false by selling heavy and pushing price back into the descending triangle.
Bottom Line
There are many patterns out there that you can trade, and the descending triangle pattern is one of the more sought after patterns.
The vast majority of people believe that this pattern is inherently bearish in the stock market – it isn’t. Bulkowski’s work on this pattern shows it is an extremely bullish pattern.
Identifying this pattern and determining the breakout strategy you want to employ is going to be a substantial factor in determining the profitability of this pattern.
Whether you take a trade after the retest of the breakout or you, wait for a break of the second-highest high, both give excellent opportunities with high probabilities of profit with minimal risk.
And know this: there are a significant number of professional traders who actively trade against patterns because they know a large number of traders can get stopped out of their trade when the pattern fails to produce a profitable trade!
Look for pattern failures as well.
If you take a buy entry on the breakout of the descending triangle pattern but price moves back into the wedge and breaks out lower, that is a strong countertrend signal and an excellent signal for you to get out of the trade.