

Under standing how to measure market sentiment is a good way to form a thesis for your trading and to determine which direction is a more likely outcome.
Intro
Have you ever been bullish about a specific stock just to find out that many investors have already had the same idea?
This scenario can be very frustrating and there is nothing worse than buying late into a bullish trend. One way you help yourself avoid getting in late is to evaluate investor sentiment.
Investor sentiment describes investor confidence toward a specific market or asset. When learning how to measure market sentiment, you can look at extreme levels of sentiment which might help you avoid buying when sentiment is too high or selling when sentiment is extremely low.
How to Measure Market Sentiment
Measuring confidence can help you determine if either fear is pervasive or greed is too high. There are several particularly good instruments you can use to determine crowd psychology that will provide you with a view of bullishness or bearishness.
Most trading indicators used by investors focus on price or volume but there are also sentiment indicators that can be used to determine investor confidence.
The data used to calculate sentiment indicators can vary more widely than traditional market indicators. Instead of focusing on price or volume, you might consider total open positions. You might also evaluate survey data or whether investors are protecting themselves from adverse market changes.
Some of the more popular sentiment indicators include:
- The Commitment of Trader Report
- The VIX Volatility Index
- The Put/Call Ratio
The Commitment of Traders Report
The futures market is a liquid financial securities market that provides contracts based on the future prices of stocks, indices, currencies, and commodities. The most active futures exchanges are in the United States. The futures positions held by investors are reported to the US oversight regulator.
Every week, the Commodity Futures Trading Commission reports position information to the public. The report is known as the Commitment of Traders report, and it produces a writeup that shows you change to open interest for nearly every commodity.
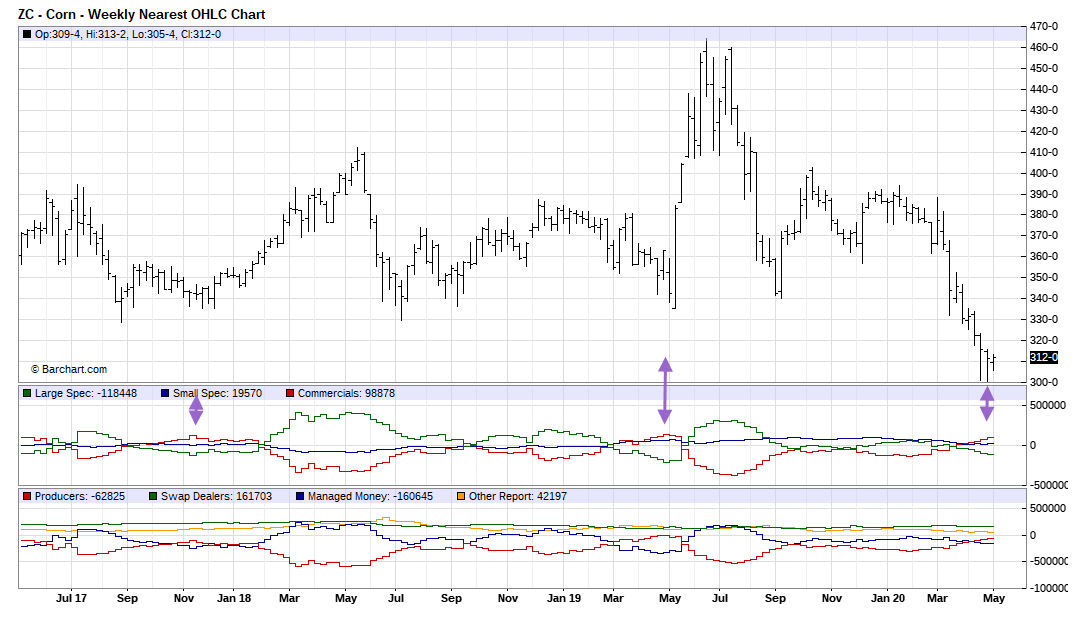
Each report is broken down into several categories. In this example of Corn, which is traded actively on the Chicago Board of Trade, the CFTC breaks down the category of traders into Swap Dealers, Managed Money, and Other Reportable.
Swap Dealers are banks that represent producers. A producer is generally selling his/her harvest forward through banks who are swap dealers, who in turn hedge using corn futures. Managed money represent several different types of investment companies including hedge funds, mutual funds, and even exchange-traded funds.

The COT report shows the open interest in futures, options, and the combination of both, for each category of trader. For example, for the week ending April 28, 2020, managed money was long 126,858 contract of corn futures and options and short 287,833 of corn futures and options.
What this open interest information tells you is that on the date this information was reported, hedge funds in aggregate were short corn futures and options contracts and are expecting the price of corn to go down.
The short open interest is approximately 2.3X long open interest. You then might infer that bearish sentiment on corn prices is pervasive.
The figure under the open interest tells you the change in positions during the past week. From this report, you can see that hedge funds barely changed their open interest increasing both long and short positions by approximately 1,000 futures contracts.
This tells you that there has been little change in sentiment over the prior week. When this number starts increasing or decreasing, sharply as a ratio of the total open interest, you can infer than sentiment is changing.
Many investors use this information to place a contrarian trade. This is just one factor you might consider when developing a trading strategy.
The chart of corn prices set off against a line chart of futures open interest that as large specs (managed money) show you that when net large spec open interest reaches an extreme the price of corn will begin to reverse.
You might consider using this type of sentiment index in conjunction with technical indicators to find precise levels of entry.
Measuring Fear and Greed
Another way you can gauge sentiment is to determine levels of fear and greed base on the demand for assets that mitigate risk. The most common way to reduce risk without buying or selling the assets is to hedge using options.
The most important component of an option a metrics called implied volatility. This is a market component that makes option premiums rise as it rises and drives option premiums lower as it falls.
Implied volatility can be measured with some of the tools offered by the Chicago Board of Options Exchange (CBOE). The most popular of these indices is called the VIX. The VIX volatility index measures the implied volatility of the “at the money” strike prices of the S&P 500 index.
The CBOE offers many different types of VIX indices. This includes the oil VIX the Euro VIX, the Gold VIX, as well as the Apple VIX. Each of these indices reflects the “at the money” strike price implied volatility of the underlying asset.

A chart of the VIX volatility index shows you periods when there is extreme fear relative to periods of extreme complacency and everything in between. When the VIX on a monthly chart closes above 40, the market is reflecting extreme fear.
The daily close of the VIX during the COVID-19 crisis hit a high of 85. This extreme level usually tells you that market sentiment is negative and could be a time to consider buying the S&P 500 index.
Extreme complacency generally occurs when riskier assets are rising and making all-time highs. This is generally a time to be careful, understanding that protection is very inexpensive as nobody believes anything bad will happen.
Extreme levels on the VIX can persist for some time, which means that you should use this index in conjunction with other indices to generate your trading strategy. Another sentiment index that also uses options is the put to call ratio.
How to Measure Market Sentiment with the Put/Call Ratio
The Put/Call Ratio is an indicator that reflects the put volume that occurs on a specific day relative to the call volume. Since options are used as a tool to mitigate risk, its important to see where there is more volume on a relative basis.
The Put/Call Ratio rises above 1 when put volume exceeds call volume. When the Put/Call Ratio declines below 1, call volume exceeds put volume. As the ratio rises more put volume is moving through the market reflecting rising negative sentiment. Positive sentiment is rising as the ratio declines.
You can use technical indicators on the Put/Call Ratio to help you determine trends.
One way you can use the Put/Call Ratio is as a contrarian indicator. When the ratio surges and reaches an extreme, the sentiment is too negative. When is drops sharply sentiment might be too high. Contrarians turn bearish when too many traders are bullish and turn bullish when too many traders are bearish.

You can see from the chart of the CBOE Put/Call Ratio, that the index moves in a choppy sideways pattern, hovering around the 50-day moving average. When sentiment is very high, as it became in early March of 2020 before COVID-19 started to spread rapidly throughout the United States, bullishness is pervasive.
Within a week, volume surged higher, pushing the Put/Call Ratio well above 1, and to the highest level, the ratio had seen in more than a year.
Why Use Sentiment Indices?
As an investor, you want to make sure that you have all the information available before you place a trade. Whether you are a fundamental analyst or technical analysis, understanding sentiment, will help you determine if there is an impetus for gains in the direction of your trading idea.
While positive sentiment might not deter your bullish trade, if you place the trade when sentiment is at a positive extreme, you are buying into the euphoria. The benefit of using sentiment is you might be able to see when the market is offsides.
When too many people are bearish, a catalyst for higher prices is traders rushing to cover short positions. This snowball effect could be the start of a trend that needs to be monitored.
Bottom Line – How to Measure Market Sentiment
Investor sentiment is a useful metric to determine the level of bearishness or bullishness held by traders. You want to use sentiment in two ways. You can use it as a contrarian index to enter a market when sentiment levels have reached an extreme.
You might consider using sentiment in conjunction with other fundamental or technical analysis tools.
A second way you could use sentiment is as a warning signal that a current or potential trade has too many investors leaning the same way. You want to avoid buying into extreme positive sentiment and avoid selling into extreme negative sentiment.
The unwinding of extreme sentiment is a catalyst that you can use to potentially enter a trade. When too many traders are caught offsides as sentiment reaches an extreme, the impending move can be very volatile.