

How To Categorize a Sell off
When speaking of a market sell off, it’s first crucial to categorize what we mean by a sell-off.
Your definition should vary based on your holding period and time frame, but we need to be consistent.
Here are a few ideas on how to categorize the severity of market moves:
- A multiple of ATR drop in a time period (i.e., “a 3x ATR decline in the space of three days constitutes a sell-off”)
- Price moves below lower bands (Bollinger Bands, Keltner Channels, and VWAP bands can all serve this function).
- Rises in the VIX
- Percent declines
- Standard deviations
To me, it’s most simple to use a measure of either standard deviations or ATRs.
There are tons of tools that can do this for you, whether technical indicators, but a straightforward way is to plot +/- two or three standard deviations around a linear regression line.
This methodology is quite popular among mean reversion traders.
Here’s an example of what that looks like:
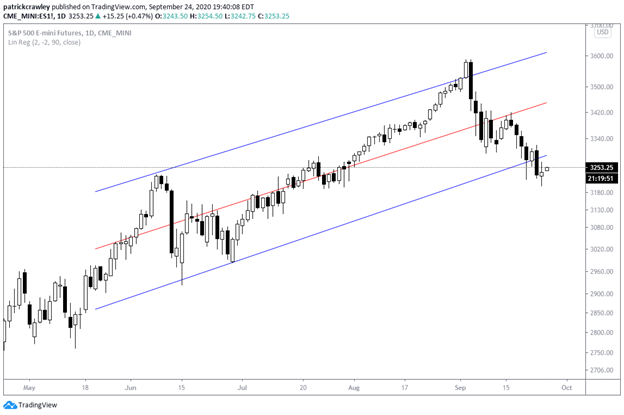
A drawback of using this indicator is that it doesn’t take volatility into account the way Bollinger Bands do. As always, it’s a weighting process.
Using the VIX can be dicey, as it and other volatility indexes might not be an accurate representation.
For example, in the later stages of the most recent post-coronavirus rally, the VIX and the indices rose in tandem.
So while there’s historically a strong negative correlation between the two, they become dislocated when the price of options premium starts to rise, regardless of what the market does.
Percent declines don’t take into account the level of overall volatility in the market.
Aside from tools that give concrete readings, simply analyzing price action is more than enough to decipher between a sell-off, random market noise, and a pullback.
Momentum or Mean Reversion?
Most directional trading strategies take advantage of two persistent market phenomena: either the tendency for large moves to see follow-through (momentum) or the precise opposite, the tendency for large moves to revert to average prices.
It might seem contradictory that both would work, but billion dollar funds are trading both strategies. They just have very different parameters to identify profitable situations.
Most traders are more comfortable taking on one of these phenomena as their trading philosophy/style.
Generally, contrarian folks who can psychologically deal with buying falling knives gravitate towards mean reversion, and folks who feel comfortable trading with the prevailing trend favor momentum trading.
Both are profitable, but it’s probably much more comfortable for a novice trader to learn momentum trading/investing.
Depending on which of these styles appeals to you, you’re looking for very different things from the market.
When the S&P 500 sells off in a big way, mean reversion traders are looking to buy that dip while momentum traders are looking for a potential change of trend to go short.
If you don’t have a well-defined plan for how to trade such a situation, you’re flying blind and are at the whims of your current emotional and mental state.
During one such sell-off, you might feel the inclination to buy, while another might prompt you to get short and seek to trade for the trend reversal.
The bottom line is that you need specific rules to identify profitable market conditions.
That’s not to say that you need to become a calculated systems trader, but that you just need to know what your edge is in pretty concrete terms or else it becomes too easy for a mental lapse to fool you into taking suboptimal trades.
These rules can be as simple as “I fade 3+ standard deviation moves away from the 10-day moving average/linear regression line/any trading tool.” They can also be quite complex, with rules so strict that you can trade it algorithmically.
Either way, knowing your precise plan of action when a market sell-off occurs is the first step.
You can also just use sell-offs as a filter not to trade because trading on the short side is challenging for most traders anyways.
We’ll touch more on this later in the article.
Is it a Pullback or the End of a Trend?
Strong trends typically end with explosive strength. Volatility quickly advances, and the most massive single-day moves are made.
You could say that this occurs in the ‘late-stages’ of a trend, but you can really only identify what constitutes “late-stage” in hindsight.
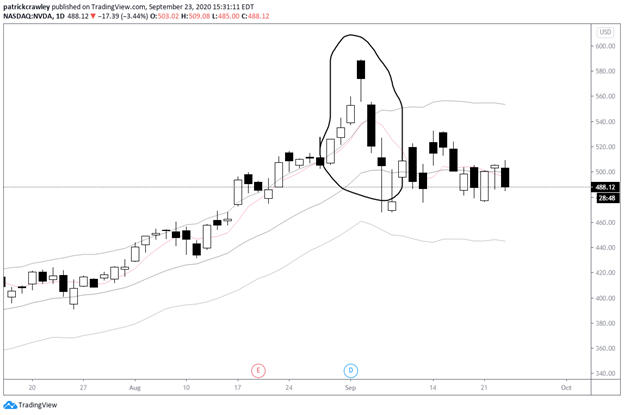
One such pattern that can indicate the end (or potential reversal) of a trend is a sharp increase in the slope of the trend, followed by a bearish candle at the climax.
By an increase in slope, I mean that the trend goes from looking like a slanted upward (or downward for downtrend) trendline to a virtually vertical line, or “parabolic,” to use common trading vernacular.
Let’s look at a chart example in Nvidia (NVDA).
You can see a change in the character, indicated by the string of bars outside of the trading bands, followed by range expansion in the ‘climax’ bar. The next day, the stock gapped down on considerable momentum, threatening the status of the trend.
But, notice how instead of immediately reversing to the downside, the uptrend simply stopped.
A new trend doesn’t always start when one ends. It’s quite common for the stock to consolidate before deciding it’s next direction.
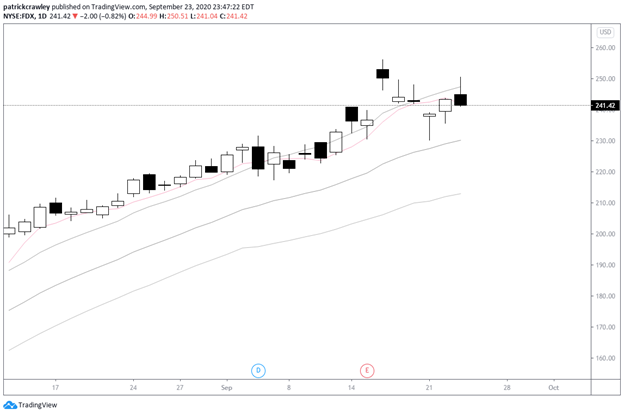
A situation you want to be wary of is categorizing a pullback as a sell-off.
In high-volatility momentum stocks, the pullbacks are more violent because the ascent is more violent. Pullbacks and sell-offs need to be measured in the context of each market’s volatility.
Let’s look at FedEx (FDX), a stock that has remained strong compared to the rest of the market.
A Warning on Chart Scaling
When analyzing these types of explosive trends, it helps to use a logarithmic chart to account for large percentage increases.
The two commonly used price scales, linear and logarithmic, can dramatically affect how you perceive price action.
On a linear chart, each advance/decline in one dollar is treated equally, because the y-axis (price) is scaled equidistantly.
Consider this example:

In the above chart, it seems as if the stock didn’t move at all until that breakout in late July 2020.
However, let’s look at this same chart, but scaled logarithmically.
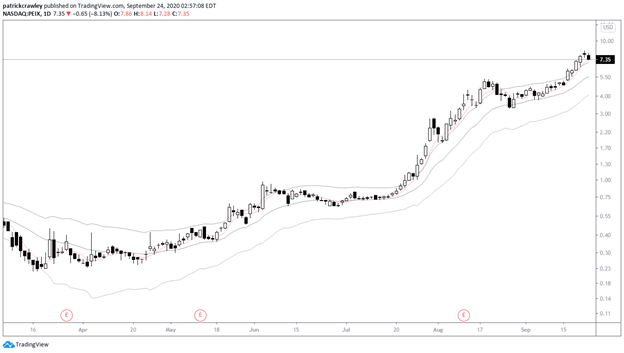
You can still see that volatility increased at the breakout point, but the linear chart hid the volatility when the stock was trading at lower prices. What’s going on here?
Well, here you have a stock that went from trading below $0.50 to above $7.00 in a short period. A linear chart treats each $0.01 move equally, regardless of what price the stock was trading at.
So, when PEIX was trading at $0.25, a $0.01 move meant a 4% price change. Conversely, at today’s price of $7.35, a $0.01 move is only a 0.1% change.
On the other hand, a logarithmic chart, the y-axis is scaled based on percentage changes, meaning that if a stock doubles, it doesn’t distort history the way a linear chart does.
Why Doing Nothing May Be The Best Option
One possibility is to do nothing other than reduce your exposure.
The stock market has a strong upward bias over time (roughly 12% with dividends), as you’re likely aware. And due to the strong mean-reverting tendencies of equities, they’re likely to bounce back from sell-offs.
If you’ve already identified a sell-off and are looking to join the trend, it’s possible that you’re too late and can be shorting stocks at precisely the time when the odds are most stacked against you.
Shorting stocks is also tricky.
When stocks sell-off, they tend to do so in a violent fashion.
Just pull up any index chart and look at the price action around crashes. Once those really violent moves have occurred, it’s pretty unlikely for that to continue unfettered.
The bulls always have their day in court, and even if they fail, they’ll make a convincing argument.
What occurs after the first swing downwards in a bear market are typically violent whipsaws up and down, making it very difficult to trade directionally.
On a structural level, the stock market is basically rigged against potential short sellers. To start, you have to borrow the shares from someone who owns the stock and pay them. And that’s if you can even locate the shares in the first place.
If you trade low-float stocks, you’re invariably used to the tickers you trade having ‘HTB’ or ‘hard-to-borrow’ labels in your platform.
Frequently, you can’t even locate shares to borrow, and when you do, your broker will charge you fees for locating them.
If your broker can locate the shares, actually shorting that stock typically comes with a sky-high borrow interest rate.
This is the interest you have to pay to the owner of the shares you’re borrowing.
As an extreme example, Nikola stock recently had borrow rates north of 600% annualized following a bearish investigative report.
Bottom Line
Regardless of your trading strategy during market sell offs, the most important thing to remember is sticking to your plan.
Your plan will help you stay out of trouble and allow you to make quick decisions if things go against you.
As always, your first job as a trader is to protect your money. Without it, you can’t trade!