

The Inverse Head and Shoulder Pattern (also called a Head-and-Shoulder Bottom or Upside Down Head-and-Shoulder Pattern) is a fantastic bullish reversal pattern and one of my favorite patterns to trade.
For markets that have a fixed supply and are naturally long-biased (the stock market), this pattern is a powerful one for the permabull. In a nutshell, this pattern is just like the typical head-and-shoulders pattern.
However, there are some key differences and performance metrics that should be noted. Throughout this article, I will be referencing the work of foremost world expert on chat patterns, Thomas Bulkowski (Encyclopedia of Chart Patterns, 2nd Edition).
This article will discuss how to identify the inverse head and shoulder pattern, how it is constructed, the proper criteria to confirm the pattern and strategies to trade this very bullish pattern.
Inverse Head And Shoulder Pattern
The Inverse Head-And-Shoulder pattern is an example of a bullish reversal pattern. This means that the price action and trend that occurred before this pattern developing was bearish.
The inverse head-and-shoulder pattern often shows up at the bottom of a move in the market. That is not to say that this pattern can not develop at the top of a market – it can – but it is infrequent.
Similarly, we can see standard head-and-shoulders patterns emerge at the bottom of a move. The inverse head and shoulder pattern is one of the more powerful and consistent bullish reversal patterns.
Let’s look at some of the components that make up this pattern:
- The pattern is made up of three troughs or three triangles.
- The left and right shoulders (triangles) should be close to symmetrical. Meaning, they should be very similar in their shape (same time and price measurements). I’ve found this to be a very, very important but often overlooked condition that helps increase the success rate of this pattern.
- Volume tends to decrease. Volume is highest on the left shoulders and then falls into the right shoulder. Patterns that have volume dropping on the right shoulder have a high probability of becoming profitable.
- The neckline must be broken for the pattern to be complete.
- The breakout above the neckline must be on higher volume. Low volume breakouts indicate a false breakout.
So what does it look like?
See below:

The chart above is Microsoft’s (MSFT) 15-minute chart. The image above is an ideal inverse head and shoulder pattern that you could want to see. The left shoulder low is above the right shoulder low, volume decreased as the pattern developed, and the two shoulders are relatively symmetrical.
A quick note about symmetry: it doesn’t have to be exact. Now, you’ll read and hear many people say that symmetry is symmetry, and symmetry means equal. Nothing is perfect in the market.
How do you determine if the right and left shoulders qualify as similar? Use your eyes. If it looks like all three are reasonably equal, then that’s good enough. No need to be so dogmatic and exact!
The other condition on Microsoft’s chart that makes this pattern so ideal is the gap above the neckline (1). Remember: the inverse head and shoulders pattern is only complete when the neckline is broken.
However!
There is a big difference between the standard head and shoulder pattern and the inverse head and shoulder pattern. With the regular head and shoulder pattern, we never take a trade until the neckline is broken.
Attempting to anticipate the formation of a regular head and shoulder pattern is akin to chasing straights and flushes in poker. With an inverse head and shoulder pattern, we can enter early.
Bulkowski wrote that you don’t need to wait for the neckline break because the failure rate of this pattern is so low.
If you look at #2 marked on the chart, you’ll see an example of a pullback. Pullbacks are entirely normal and expected behavior in almost every chart pattern that exists.
Some traders call this the ‘retest’ or the ‘confirmation test’ – meaning that if price bounces off the prior breakout level, the breakout is confirmed and legitimized.
It has been my experience that with the inverse head and shoulder pattern, retests of the breakout are not nearly as frequent as they are with a regular head and shoulder pattern.
Watch out for failed and false breakout patterns

The chart above is Apple’s (AAPL) 5-minute chart. You will notice that there is an inverse head and shoulder setup, but price didn’t break, though. Instead, price moved up to the neckline and was rejected lower (it eventually did trade higher).
Rejected breakouts or breakouts that return below the neckline on the inverse head and shoulder pattern are rare, but you should watch out for them.
If you observe the inverse head and shoulder pattern at the top of a move or trend, it will more than likely fail. You see, the same thing occur with a regular head and shoulder pattern that develops at the bottom of a move.
Failed patterns are also great trading opportunities. Some of my favorite trades to take are on failed patterns. There is a slew of trading strategies that focus specifically on trading the opposite side of patterns.
Incomplete and/or failed inverse head and shoulder patterns behave in one of two ways.
- Price action is rejected higher (Apple’s chart above).
- False breakouts: Price breaks above the neckline, but then retraces back to the neckline and ultimately begins to trade lower.
The second scenario is one of the more profitable trade setups. The frequency of a false breakout on the inverse head and shoulder pattern is rare – especially if it forms at the bottom of a swing.
False breakouts most often occur when the inverse head and shoulder pattern forms at the top of a swing.
The profitability of a false breakout can be extremely high, but be careful: the price action is often violent and swift, so be cautious about how long you would hold on to any short.
Easily identify profit targets
One of the great things about all head and shoulder patterns is the ability to identify profit targets quickly. There are several methods out there to identify profit targets, but I’ll share the two that I use.
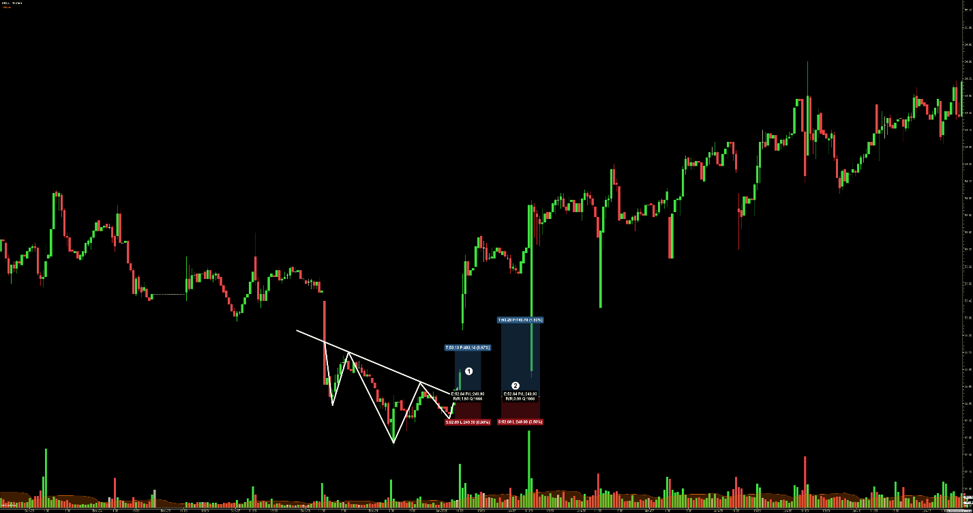
I am using Oracle’s (ORCL) 15-minute chart for this example. The first profit target is determined by taking the low of the head and subtracting that from the breakout level of the neckline.
We then add the difference to the breakout level (#1). The second method involves the difference between the neckline directly above the head and the low of the head.
We then add that difference to the break of the neckline to establish the next profit target (#2).
Stop orders can be placed a few ticks below the right shoulder or below the head.
Trading Tips Recap
Trade the inverse head and shoulder pattern only in a bull market.
It’s important to know what the overall trend is before taking any trades with this pattern. Whether you are using the 200-day moving average or the true strength index to identify the trend, make sure that the overall trend is bullish.
Buy the inverse head and shoulder pattern when prices are trading near yearly highs.
This may sound counter-intuitive for those who don’t trade long-biased markets like stocks, but new all-time highs and yearly highs most often turn into the new primary support levels. When you see the inverse head and shoulder pattern appear near major highs, it may be a great early entry.
Tall and narrow patterns perform better than short and wide patterns.
I try to avoid inverse head and shoulder patterns that have wide shoulders. They tend not to have much upside potential and have very weak breakouts.
Patterns with volume decreasing on the right shoulder perform better than patterns with equal or higher volume in the right shoulder.
If there is one condition that will decrease the profitability (or outright nullify) of the inverse head and shoulder pattern, it is volume. The most critical volume aspects are the drop in overall volume on the right shoulder and an increase on the breakout above the neckline.
If you recall Oracle’s 15-minute chart, look at the volume on the breakout above the neckline: it is almost 5x the 20-period average.
Patterns with a higher left shoulder have a higher positive expectancy rate (the left shoulder’s low is a higher low than the head and right shoulder).
I’m going to go ahead and suggest that if you see an inverse head and shoulder pattern with a right shoulder lower than the left shoulder, ignore it. Often the rise on the left shoulder is so steep that many indicators put the breakout into severely overbought territory.
When the left shoulder is below the right shoulder, we have favorable price action conditions that show the beginnings of a Bollinger Squeeze and/or oversold conditions. I do not worry about the shoulder heights in markets like futures or forex, just stocks.