

Whether you’re day trading or making long-term investment decisions, it’s important to know what the markets are doing. Often this is done with market indexes, such as the S&P 500 or the Russell 1000.
But these values don’t always give you the whole picture, and oftentimes they don’t. That’s why smart traders use market breadth indicators.
What is Market Breadth?
Let’s say you look at the Dow 30, and you see that it’s up 1.4%. So you conclude that the market has upward momentum for the day. The reality, however, could be that only a handful of stocks are pushing up the index.
The majority of stocks in the index could actually be in the red for the day. So the index doesn’t always give you a complete picture of what the market is doing.
A market breadth indicator is a technical study that lies on top of or below a chart. It considers the number of securities advancing relative to the number declining in the index.
We say that there is negative market breadth if more equities in the index are declining than advancing. This situation could occur even though the overall index is up.
And there is positive market breadth when the opposite situation is occurring. In this situation, more assets are advancing than declining, regardless of what the overall index is doing.
Some market breadth indicators look at volume, too. These are important technical tools. Why? Because price changes that are connected to increased volume are more important than those that occur during times of low volume.
Why It’s Important to Understand Market Breadth
Market breadth tools provide a different way of analyzing the equity markets that other technical indicators can’t. To make informed trading decisions, you need to understand the market’s movements.
If a market pull back or upturn is broad-based, it’s less likely to be short-lived. A market breadth indicator can tell you if the movement is the result of just a few stocks. It can also tell you if it is the result of overall market movements.
Bears are considered to be in control of the stock market’s momentum when there is negative market breadth. This is the case regardless of what the index reads. And bulls are in control when there’s positive market breadth.
By using market breadth indicators, you can discover weaknesses and strengths in the price action of an index. Such detailed information is not detectable simply by watching a chart alone.
Examples of Market Breadth Indicators
There are several market breadth indicators. Some use volume, while others don’t. Some indicators look at securities that reach certain milestones, while others analyze several variables.
Market breadth indicators are frequently used in conjunction with other technical analysis tools to more fully evaluate price action.
New Highs-Lows Index
This technical study looks at assets reaching 52-week highs. It compares them to other assets in the index hitting 52-week lows. A figure less than 50% means that more assets are hitting 52-week lows compared to assets doing the opposite. This is generally regarded as bearish territory.
Some traders take 30% to be a sell signal and 70% to be a buy signal.
Advance-Decline Index
The advance-decline index is usually referred to as the AD line. The indicator computes a total of the difference between the number of declining and advancing components of an index. The result is known as net advances.
The more components that participate in a trend, the stronger the overall movement. The opposite is also true.
If we look at the chart below, we can see the AD line on a 1-day chart of the S&P 500.
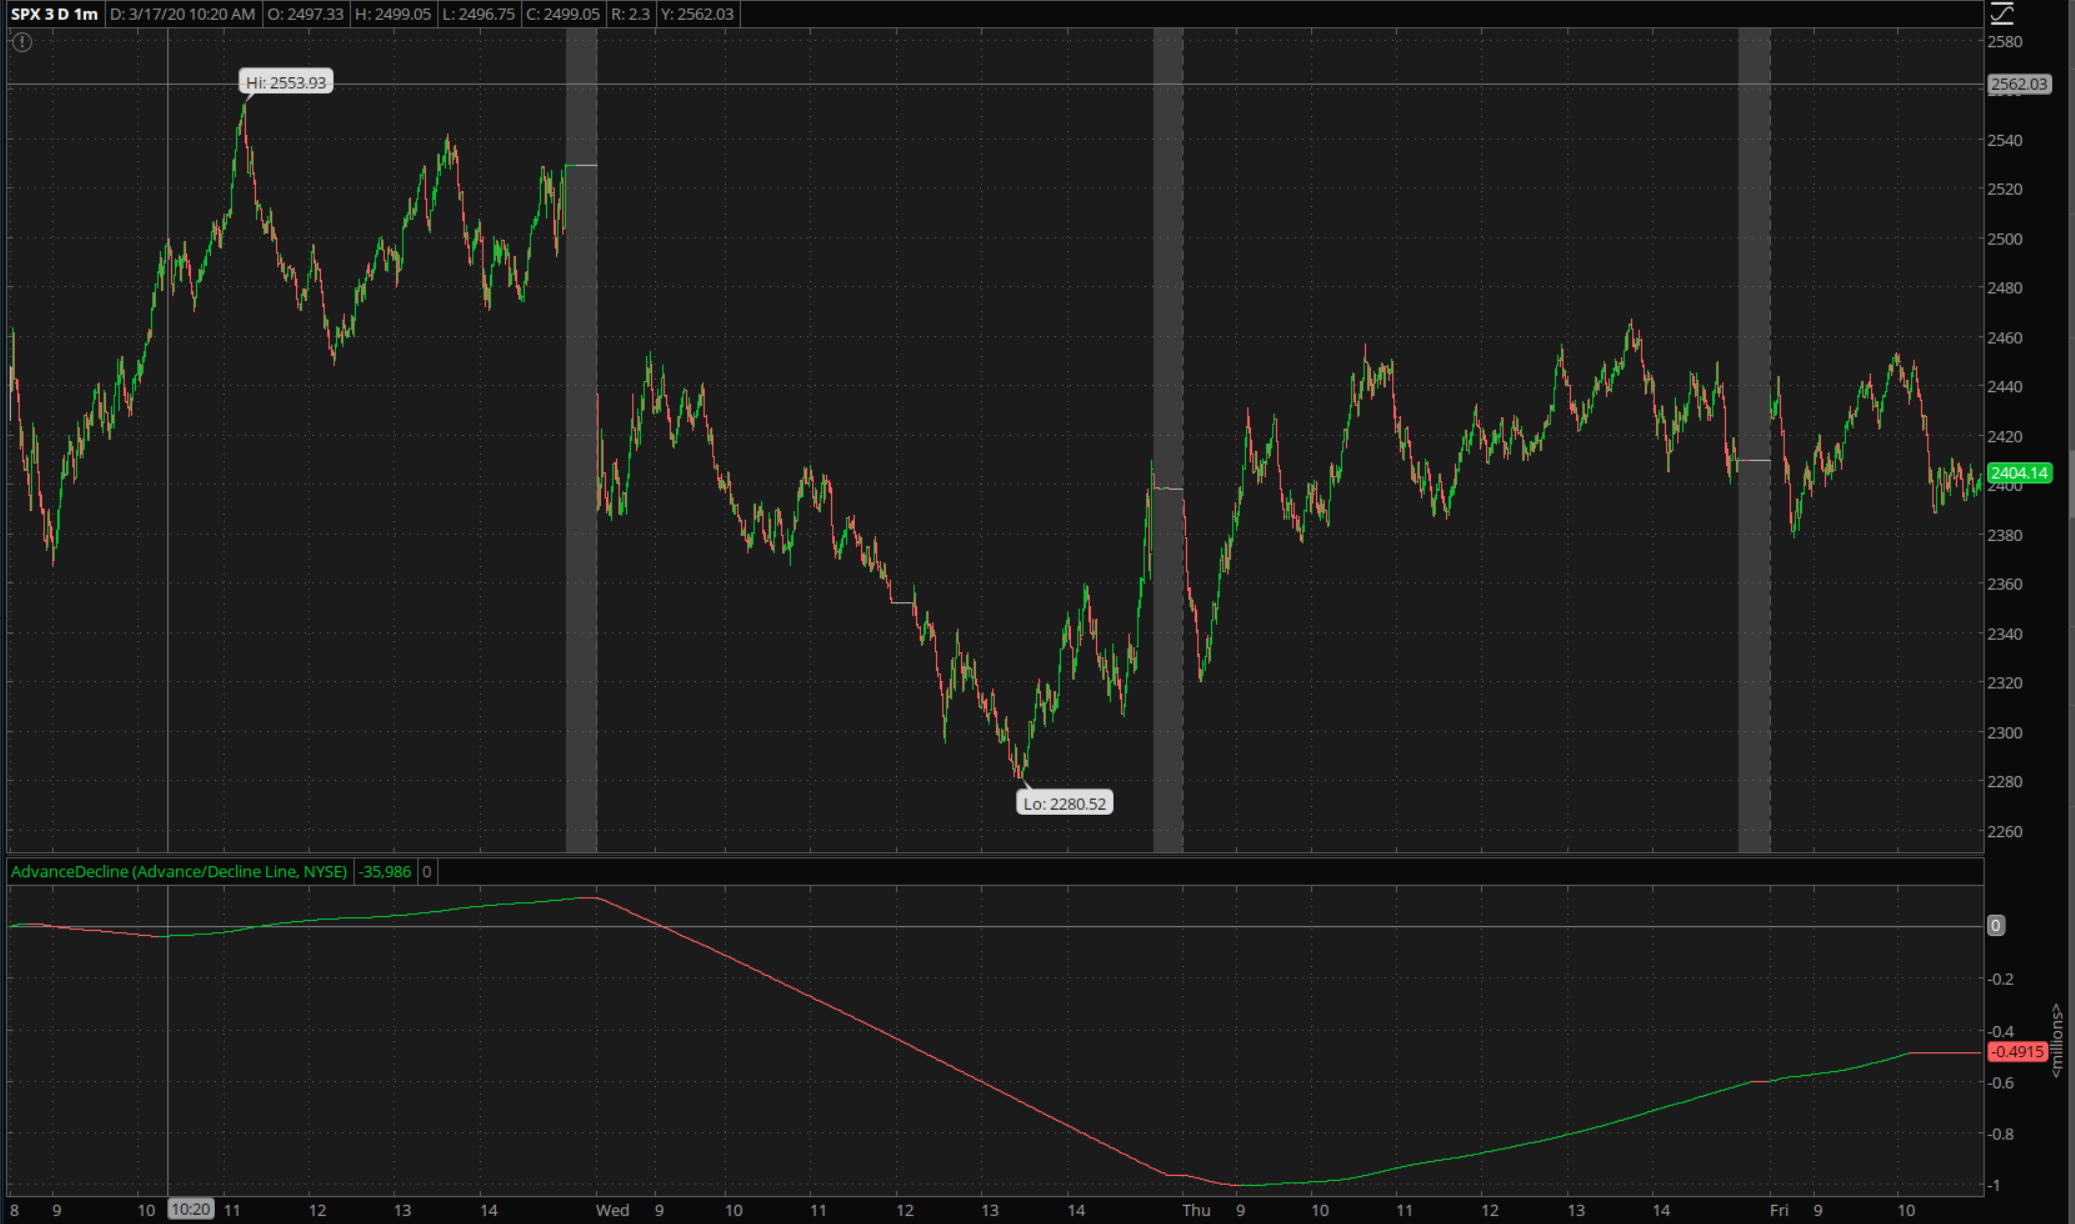
When analyzing the AD line on a chart, you want to try to spot divergence to predict trend reversals. If an index is experiencing an uptrend, and the AD line is falling, it means the current price action may soon lose momentum.
S&P 500 200-Day Index
This indicator shows the number of stocks in the S&P index that are currently trading above the index’s 200-day moving average. Anything above 50% shows broad market strength. The higher the number, the more overbought the market is considered.
If the figure drops below 30%, it’s considered a bullish signal. Thus, the S&P 500 200-day index can be used in a similar fashion as the new highs-lows index.
Cumulative Volume Index (CVI)
The cumulative volume index determines if money is coming into the market or moving out of it. The way the CVI is calculated is pretty simple:
Advancing stocks – declining stocks + previous period’s CVI
We can see the CVI in action in the following 3-day chart of the Russell 1000.

The CVI shows in graphical format if there has been more down-volume or up-volume.
When using the CVI, you want to try to spot areas of divergence. This is when an index’s trend doesn’t match the indicator’s trend. When this situation occurs, it’s likely that the index will correct itself. It will follow the direction the CVI is pointing in.
Arms Index
The arms index is sometimes referred to as the trading index (TRIN). This one is an oscillator that works best in short timeframes. It uses the advance-decline index we looked at earlier and divides it by the advance-decline volume ratio.
The calculation of TRIN is straightforward:

Advances are the number of equities in the index that closed in positive territory during the day’s session. Declines are of course the opposite.
Advancing volume is the total volume that advancing stocks put on the board. And declining volume is the total volume from declining stocks.
The TRIN ratio will stay above 1.0 if declining stocks are the primary source of volume. On the other hand, if advancing stocks are the principal source, the ratio will stay under 1.0.
Most traders view a TRIN ratio of less than 1.0 to be a buy signal. A figure more than 1.0 is considered to be a sell signal.
Bottom Line
Indexes are only one indication of overall market movements. To fully capitalize on all trading possibilities, you need more information. Market breadth indicators provide this information and can deliver insight that other traders are missing.