

COVID-19 Crisis
The past month of financial markets activity can be summed up by one phrase: black swan.
While some traders were able to establish short positions well before the pricing-in of the disruptions, predicting the virality of a deadly virus outbreak is pretty much impossible and is why the COVID-19 crisis has caught many investors off guard.
But, here we are, trying to make sense of it all amid massive uncertainty. When it comes to markets, there are so many interesting questions to ask about the short and long-term consequences COVID-19 will leave us with.
While most of these questions cannot be answered definitively without the benefit of hindsight, we’re going to take a look at some publicly available data and look “under the hood” of the markets and economy.
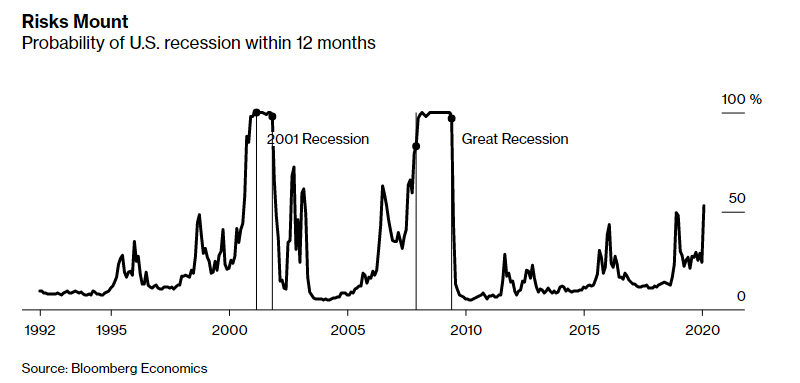
Bloomberg Is Forecasting a 53% Chance of Recession
Bloomberg Economics has a model to forecast the odds of a US recession within the coming 12 months. The model takes into account the price of the S&P 500, the yield curve, and macroeconomic factors like the unemployment rate and the federal funds rate.
The index is currently projecting a 53% chance of a recession occurring within the next 12 months, a level not reached since 2007.
It’s worth noting that in December 2018, the index was at 49% and a rally followed (that is not to equate today and December 2018 at all… these are two very distinct market environments).
Depending on how long the US economy is essentially halted, with non-essential businesses closed, we could see the risk of a significant recession raise in the coming weeks, as macroeconomic numbers are released.
As cash-poor businesses are forced into bankruptcy, that will tack on additional pressure to the already stressed credit markets, resulting in ripple effects throughout the global economy.
Smart Money Is Unusually Bullish
From my own analysis, as well as checking with other managers and analysts I highly respect, everyone seems to agree that they haven’t experienced such a high level of uncertainty since 2008.
It has historically paid to “buy when there’s blood in the streets,” but sometimes the market is correct. Sometimes fear is warranted, especially when a deadly virus is forcing the entire US economy to screech to a halt for an unspecified period of time.
With this said, smart money bullishness is near historic highs following one of the fastest crashes in US market history.
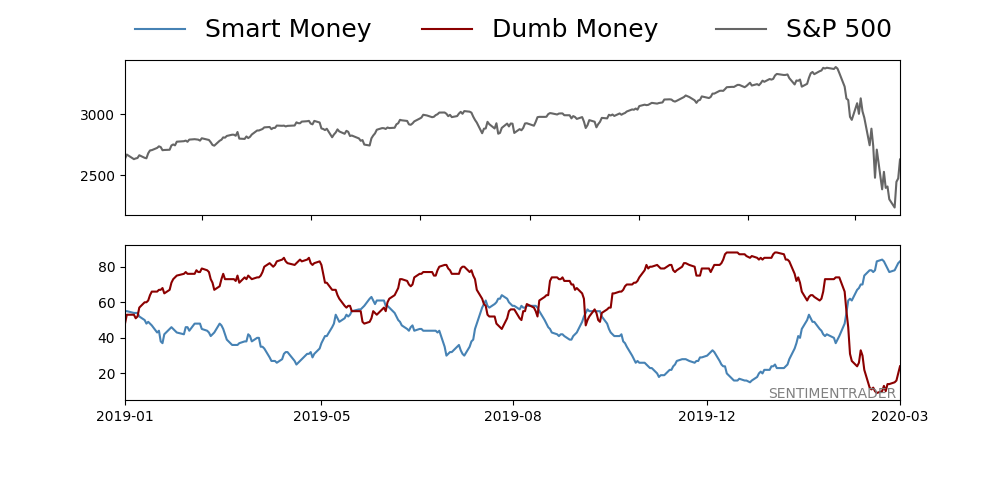
This index derives smart money indicators as “the OEX put/call and open interest ratios, commercial hedger positions in the equity index futures, and the current relationship between stocks and bonds” and others.
The organizers of this index, Sentimentrader.com, opine that smart money is better at market timing than dumb money, who routinely buy tops and sell bottoms.
While this index has served as an excellent tool for identifying points at which the weak hands have been folded out, there are other forces at play.
JP Morgan’s Marko Kolanovic, who is head of their Macro Quantitative and Derivatives Strategy team expected something like this to play out in global markets for a while, due to minutia in market structure, calling it the “Great Liquidity Crisis,” caused by the move into passive management, and flawed risk management/hedging strategies on the part of large market players.
“The Great Liquidity Crisis”
I’m no expert the nitty-gritty of market structure, nor am I in hedging, volatility exposures, or anything that is creating these massive swings in asset prices and volatility (as a reaction to COVID-19 crisis and oil price war news).
So instead of trying to analyze it and probably misinterpret several aspects, I’ll include some choice quotes from the astute Marko Kolanovic of JP Morgan, as highlighted by Heisenberg of SeekingAlpha and The Heisenberg Report.
The Heisenberg Report, a macro newsletter written by an anonymous analyst, broke down what Kolanovic viewed as precursors to the GLC:
- Shift from Active to Passive Investment.
- Increased AUM of strategies that sell on “autopilot.”
- Trends in liquidity provision
- Miscalculation of portfolio risk.
- Tail risk of private assets.
- Valuation excesses.
- Rise of populism, protectionism, and trade wars
And to sum up Kolanovic’s description of the current market environment here is a choice quote from a recent note:
“Given that liquidity is now worse than [previous similar episodes], instead of moving +5% and -5% in alternate days, we have seen mind-blowing +10% and -10% moves on little to no fundamental news. The pattern works as follows – market moves (up or down) ~5%, and that prompts massive short convexity flows to push another ~5% in the same direction. As the convexity flows create a temporary market impact, the next day, there is a reversion as the market returns to its fundamental clearing point. So it reverts (a large part of) the gamma move, but that triggers another round of short convexity flows that push it all the way back to the starting point of previous day.”
Initial Jobless Claims Are Ugly
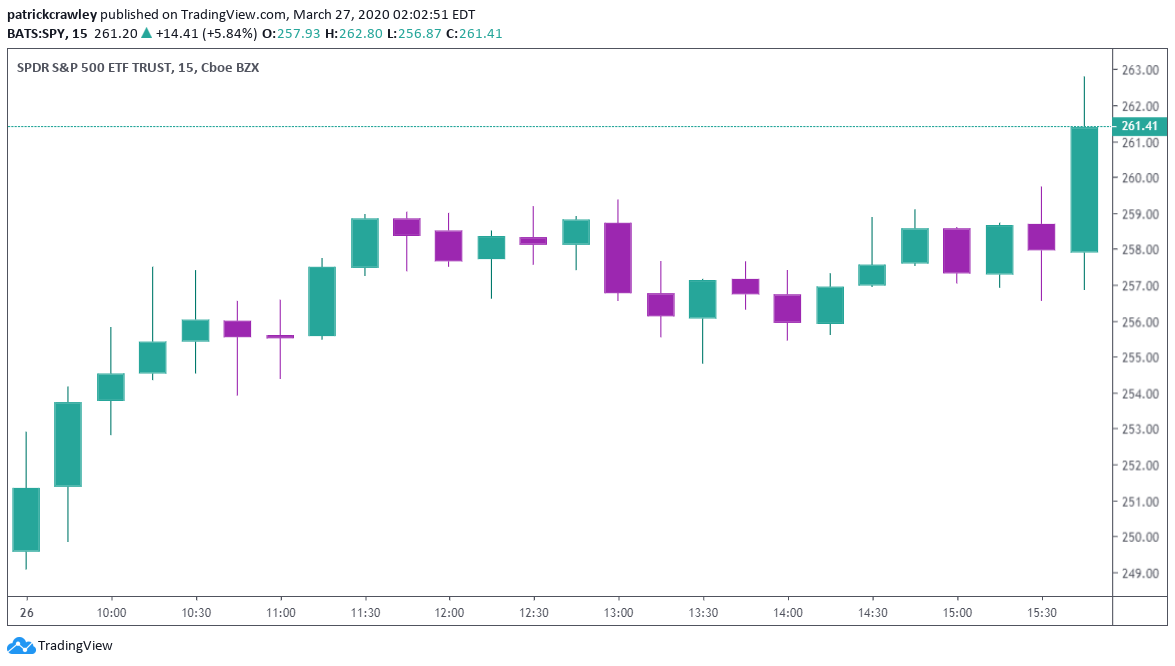
Thursday, March 26th’s initial jobless claims numbers hit their highest level since the data was first available in 1967, and by a wide margin. With data coming out on a weekly basis, this isn’t the last of the ugly data we will see.

The market shrugged off these numbers, suggesting that they’ve been priced-in as the “social distancing” measures quickly ramped up in the US and around the globe.
We also have to consider that the massive federal stimulus in the form of effective universal basic income will have a degree of an offsetting effect on consumption.
For reference, here’s Thursday, March 26th’s price action in the SPY:
ISM New Orders Contracting
The Institute of Supply Management releases a monthly report based on surveys with purchasing managers in the manufacturing industry called Report On Business.
One of the critical metrics reported is New Orders, which tracks the number of new orders those surveyed are reporting, serves as a leading indicator for the manufacturing sector, as well as the economy.
For the month of February, the index declined by 2.2% to 49.8, below 50 level, indicating economic contraction.
Commodity Trading Advisors (CTAs) Are Massively Short Equities
CTAs mostly conduct “managed futures” strategies, meaning they’re basically a hedge fund that only trade futures and currencies.
Most of these funds follow trend-following strategies, meaning they try to “ride the comet,” as John Moulton would say when significant momentum presents itself.
These funds tend to employ lots of leverage and when liquidity is low, their hedging or short covering can cause extreme volatility.

Stock Newsletter Writers Are Extremely Bearish
Many of you have heard of the American Association of Individual Investors (AAII) survey of newsletter writers to get an estimation of the market sentiment. As of today, the level of bullishness is about even with December 2018 lows.
The chart is courtesy of Bespoke Investment Group:

NYSE Market Breadth At Strongest Levels Since 2016

The NYSE Advance-Decline Difference does exactly what it sounds like. It gives a net reading of the stocks advancing on a given day. It does that by subtracting the number of advancing issues from declining issues. This is referred to as market breadth.
One way to gauge the true strength of a market rally is through analyzing the market breadth. If the broad market is up in a big way, but the breadth isn’t relatively strong, a few large issues are likely responsible for the market move.
On the other hand, when the majority of issues are advancing during a rally, the move is supported by mass buying of issues in various sectors and cyclicalities.
Many are referring to price action during this week (ending 3/27/20) as a “bear market rally,” which could very well be true.
However, strong market breadth makes that likelihood slightly decrease, at least the way I see it.
Bottom Line
Most of us have never seen a market like this. I wasn’t trading in 2008, but from what I’ve heard from my friends that did, this is entirely different (not necessarily worse).
Back then, the entire global financial system was on the brink of collapse. A few different actions from the Fed or banks could have resulted in a dramatically different outcome.
Today’s market crisis, marked by the spread of a virus, is obviously different. Of course, it’s exposed flaws in our financial system, like our over-reliance on algorithmic liquidity providers, just to name one thing, but this is a complete black swan event.
Nobody (okay, maybe ONE gold bug) was predicting that a global pandemic would disrupt not only markets but our lives, twelve months ago.
With President Trump eager to move fast to “reopen” the economy, the coming two weeks will define if the country recovers from a recession quickly (the famous “V-shaped curve”), or if the virus continues to grow exponentially.
Further, the effects of the various relief and stimulus bills to come are unpredictable.