

Most of the time when we make a trade, we’re making a pretty specific bet.
We buy Apple because we think Apple is going up for whatever reason. It’s a simple bet with one way to win: the price has to go up.
With pairs trading, you’re combining two separate bets into one.
Let me explain.
You buy one asset and short another simultaneously.
Instead of viewing these as separate trades, you combine the P&Ls of each trade and view it as one trade. So instead of betting that Apple will go up, you might bet that Apple will go up more than Adobe by shorting Adobe and buying Apple.
In this case, even if the price of both stocks decline, as long as Apple declined less than Adobe, you’ve made money.
This gives you more opportunities to make money on the trade. For example, suppose you think Apple will go up because you’re bullish on their pivot to service-based revenue.
Even if you’re 100% right on this prediction, if the global economy tanks next week and the entire market declines, Apple will decline along with the rest of the stocks. You were right, but lost money.
But let’s say you implement your bet on Apple as a pairs trade.
In addition to your long Apple bet, you also short another stock that you’re bearish on like Adobe. Maybe you’re bearish on Adobe because you just think the market is overestimating growth potential. So the same situation arises: the S&P 500 tanks next week. Both Apple and Adobe decline in price, but Apple declines less.
You’re green on the trade despite your Apple bet going wrong because your short Adobe hedge saved you.
The payoff of a pairs trade gives you several opportunities to make money on a trade, even if the original thesis doesn’t pan out as expected:
- Both stocks go up, but your long stock goes up more. You’ve made money.
- Both stocks go up equally. You’ve broken even.
- Both stocks go up, but your short stock goes up more. You’ve lost money.
- Both stocks go down, but your long stock goes down less. You’ve made money.
- Both stocks go down equally. You’ve broken even.
- Both stocks go down, but your short stock goes down less. You’ve lost money.
- Your long stock goes up and your short stock goes down. You’ve made money on both legs of the trade.
- Your long stock goes down and your short stock goes up. You’ve lost money on both legs of the trade.
Compare this to the possible payoffs from buying or shorting one stock outright:
- Stock goes up, you’ve made money.
- Stock goes nowhere, you’ve broken even.
- Stock goes down, you’ve lost money.
What is Pairs Trading?
Pairs trading involves making two (or more) bets on different, but related securities. Most of the time, you buy one security (go long) and short another security.
The classic example of a pairs trade is Coke and Pepsi.
If Coca-Cola stock goes up a lot while Pepsi remains unchanged, you would short Coke and buy Pepsi. The theory goes that Coke and Pepsi’s business are nearly identical–they’re both mature companies operating in the same industry.
Unless there’s a very compelling reason, the performance of the two stocks should be similar. Of course, this is a very strong assumption, and your trade’s success effectively hinges on this assumption being true.
Pepsi and Coke are known as a “pair” in the pairs trading world.
Pairs trading allows you to get creative in structuring a trade idea. Experienced traders have dozens of new ideas everyday, but so many of them can’t be implemented with one outright bet on a stock or asset.
As an example, assume it’s February 2020 and you’re worried that the market is underreacting to coronavirus risks.
You want to short some restaurant and travel stocks, but if you’re wrong, you don’t want to sit holding a short position in a rising market. You decide to buy some stocks against your shorts as a hedge. You pick food delivery and “stay-at-home” productivity stocks like DoorDash (DASH) and Google (GOOG).
What is a Pair in Pairs Trading?
A pair is simply any two assets that you trade against each other; one long and one short. Most of the time these are related securities: they’re in the same industry or sector, or they’re direct competitors. Here’s some examples of equity pairs:
- Coke and Pepsi
- GM and Ford
- Equifax and TransUnion
- S&P 500 and the NASDAQ 100
- Crude Oil and Natural Gas
- Gold and Silver
- Value and Growth
- Momentum and Mean Reversion
Pairs traders aren’t limited to just equities though, there’s endless possibilities. Many commodities traders make relative bets on crude oil vs. natural gas. Macro traders might bet that the S&P 500 will outperform the NASDAQ 100, or that value stocks will outperform growth stocks.
In early 2021, the “reflation” trade was all the rage, which is a bet that assets that benefit from inflation like commodities will outperform those assets that suffer from inflation, like bonds.
The Benefits of Pairs Trading
Pairs trading is a market neutral strategy, meaning that your trade’s success doesn’t hinge on the broad market going up or down in price. This can seem like the golden goose in trading: consistent results unencumbered by the gyrations of the market. But the market is pretty efficient so, of course, there are drawbacks which we’ll get into in the next section.
But done right, pairs trading is a high sharpe ratio strategy that can insulate you from market volatility.
More importantly, the strategy is not correlated to the market. So, if you run equity strategies with high correlations to the market, pairs trading can help smooth out the volatility of your portfolio.
The Drawbacks of Pairs Trading
Chief among the drawbacks is that it’s a mean reversion strategy, meaning that your average winning trade is small and your average losing trade is comparatively large. It’s pretty tough psychologically too, because the more the trade goes against you, the more sense it makes to average down.
Further, pairs go in and out of favor.
I mentioned Coke and Pepsi earlier in this post. It’s the most classic pair. You’ll find it mentioned in every book and course about pairs trading because it’s so ubiquitous. However, trading Coke and Pepsi using a traditional pairs trading strategy has been losing money for years.
So you’ll have to continually find new pairs to trade and cycle the stale pairs out of rotation. While this can seem as trivial as scanning for stocks, how do you determine when to remove a pair from your trading universe? How do you decide that a pair is robust enough to add it to your universe?
How To Find Pairs to Trade
Pairs trading is less of a specific trading strategy and more of a type of trade you can make. All it means is that you’re buying one asset and selling another against it, betting on the relative outperformance of the asset you’re buying.
As a result, there’s no set way to find pairs to trade. It all depends on your trading style and philosophy.
Many pairs traders are very quantitative in nature, preferring to use sober statistical analysis of market data to make repeatable, concrete trading decisions that are essentially algorithmic.
On the other hand, much of the equity hedge fund world are essentially pairs traders in disguise. They make pairs trades based on sophisticated ideas about business strategy, market cycles, and competitive advantages. The statistical factors that the quants care about don’t matter to them. They’ll buy Ford and sell GM because their analysts believe Ford will sell more cars at higher prices than GM.
Finding Pairs Quantitatively
Quantitative pairs trading involves using basic statistics to generate trading ideas.
Quants don’t care about business models or balance sheets. They care about how the price changes of each stock relate to each other, and whether or not that is a historically profitable trading signal over a large sample size.
Quantitative pairs traders care about how stock prices relate.
The primary two methods of identifying how stocks relate are correlation and cointegration. Put simply, correlation is the degree to which two data series move together. Cointegration is a measure of how “mean-reverting” a data series is.
In other words, when two correlated stocks diverge, cointegration measures how likely two correlated assets return to their correlated state. I’m not a statistician so do your own research to truly understand how the math works.
Typically pairs traders will scan through a list of related stocks (like stocks in the same sector) looking for pairs that are both highly correlated and cointegrated.
Because markets are pretty random, tons of spurious correlations pop up, so there has to be a rationale for why these stock prices would move together.
This can be done with the help of programming languages like Python and R, which both have open source libraries for easily running correlation and cointegration tests on market data.
For example, here’s an example of a cointegration matrix I created on some of the components of the XRE regional banks ETF:

This table is the result of running cointegration tests between every possible pair in this list of stocks, and displays the cointegration value as a color. Generally, in the pairs trading world, a cointegration of 95% or higher is considered significant, and could be indicative of a mean-reverting pair.
If you don’t want to start coding right off the bat, there’s a great tool called PairTradingLab out there, but keep in mind that it costs roughly $60 per month for the premium edition.
Finding Pairs Qualitatively
This is where the rules go out the window. When it comes to qualitative pairs trading, you could have any number of reasons for putting on a trade.
An example I really like is Michael Martin’s Microsoft vs. Netscape trade in the 1990s during the browser wars. Netscape had the first mover advantage, with their Navigator browser being the first widespread web browser for consumers, but they were a one-trick-pony with Navigator being their only product.
Once Microsoft started bundling Internet Explorer with every copy of Windows, Netscape soon started seeing their market share dwindle and their company prospects were dismal.
Martin shorted Netscape and went long Microsoft, and he said that it was one of the few pairs trades where he made significant money on both legs of the trade.
An example of a famous failed pair trade is Julian Robertson’s short NASDAQ tech stocks, long value stocks during the dotcom bubble.
Up until this trade, Robertson’s Tiger Management hedge fund was legendary on Wall Street, seeming to get everything right with the returns to back it up.
But Tiger got the timing wrong, and closed out their short near the top of the bubble, ending 1999 down 19% while the S&P 500 was up 21%.
Pairs Trading Strategy
There’s a lot of ways to trade pairs with a technical trading strategy.
There’s lots of sophisticated statistical models traders use to identify the optimal time to put a trade on. However, all of them come down to a simple trading concept: mean reversion.
The models aim to buy or sell the pair when it diverges from the mean, and close the trade when it reverts back to the mean.
So while you can’t have some of the special sauce the quant funds use with their fancy models, you can get 80% there with some very simple technical trading tools like Bollinger Bands or RSI. For a strategy so rooted in math, you’d be pretty surprised how simple some strategies can be.
Before you get started, you need to actually chart the pair. You won’t get your trading signals from the charts of the individual stocks themselves, instead, you need to create a ratio chart.
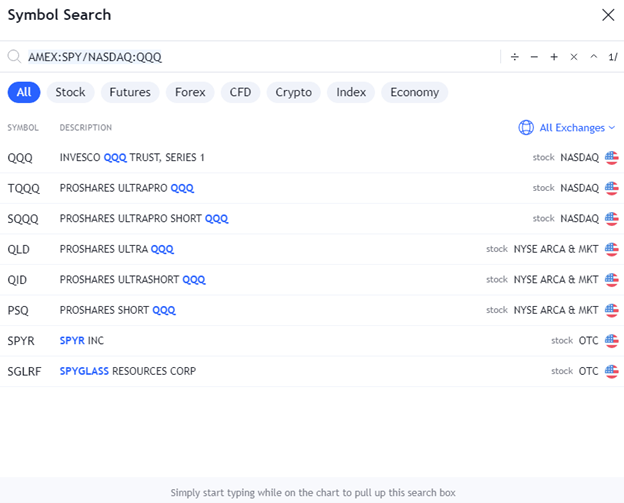
In the majority of trading platforms, creating a ratio chart is as simple as typing in “KO/PEP” or “AAPL/ADBE” into your charting platform’s symbol box. Here’s an example in TradingView:
Below is an example of what a ratio chart looks like. It’s simply dividing the first symbol by the second symbol. The chart you see below is the price of SPY divided by the price of QQQ. The result is the ratio, which as of the publishing of this article is 1.2.
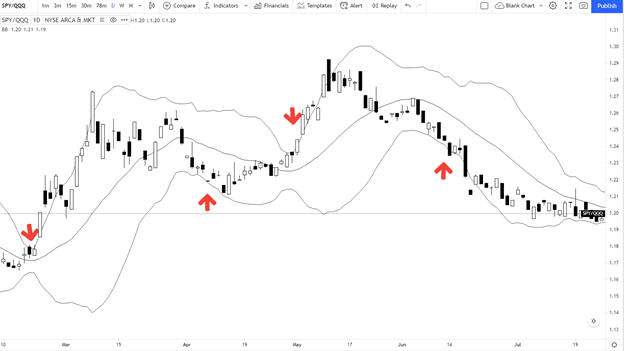
A Bollinger Bands strategy simply waits for the pair to reach one side of the band. When the ratio reaches the lower band, it creates a signal to buy the first symbol (the numerator), and short the second symbol (the denominator).
In this case, should the ratio chart reach the lower band you’d buy SPY and short QQQ.
When the ratio reverts back to its moving average (in this case a 20-day moving average), you close the trade.
When the ratio reaches the upper band, the signal is flipped. You’d short the first symbol (numerator) and buy the second symbol (denominator). In this case, you’d short SPY and buy QQQ.
Final Thoughts
For many, pairs trading is their first foray into more quantitative, math-driven trading.
Not only does it have the benefit of market neutrality, but the mathematical backing can give you more confidence to ride through the rough patches and add more to losing trades (which is often the right call in mean-reverting strategies like pairs trading).
As glamorous as it may seem, don’t think the mathematical rigour will make it any easier from more standard stock trading strategies.