

The Post-COVID rally has been tremendous after bottoming out in March 2020. However, is it here to stay or is this just a setup for another sell off?
Post-COVID Rally
On the first of the year, if I told you how the first six months of 2020 were to unfold, I think you’d be more shocked at the fact that the Nasdaq is still making new all-time highs.
Of course, there’s no shortage of market commentators opining about how irrational the market is, or how the Federal Reserve has taken over the stock market.
Supply and demand moves markets. And capital flows dictate supply and demand.
Earnings, interest rates, and the money supply mainly affect capital flows. Instead of opining about coronavirus and the government’s response, we’re going to analyze some factors which affect how much money is pumped into the stock market and see how rosy things look.
Some of these data points are supportive of the rally, while others make it look like a complete dead cat bounce.
The only thing we can be sure of is that we can’t know tomorrow’s price.
The Supply of Money Is Exploding
The Federal Reserve releases data about how much money is out there, floating across the economy.
One of the main reports they make is on this M2 Money Stock. M2 refers to the amount of money in people’s bank accounts, money market accounts, certificates of deposit, and other highly liquid sources of cash.
M2 is a leading indicator of inflation, because it straightforwardly tells you if more or less money is out there, the very determinant of inflation.
Because the US dollar’s inflation rate has been pretty steady throughout history, the M2 money supply has slowly grown over the years.
However, since the Federal Reserve’s response to coronavirus, M2’s rate of change has SKYROCKETED. In other words, the amount of money in the economy has grown significantly, at a much higher rate than what is historically warranted.
Here’s a chart of the M2 Money Stock data, as far back as the data goes, to 1981. Along with it is a one-month rate of change on the bottom of the chart.

That’s a LOT of new money introduced into the economy. Simple supply and demand tells us that each dollar is worth far less today than it was in 2019.
This is actually bullish for the stock market’s nominal returns. More available money means more money being pumped into the stock market.
High inflation and low-interest rates force investors to chase riskier yields in the stock market.
Interest Rates Are Zero
In addition to their massive expansion of ‘unlimited’ quantitative easing, the Federal Reserve also responded to the coronavirus by slashing interest rates to near-zero. The effective Federal Funds Rate as of July 1st, 2020, is 0.08%. Add inflation to that, and interest rates are considerably negative.
Interest rates are the primary incentive that drives stock market capital flows. When real rates are high, investors are happily lending their money to the government and high-quality companies for steady, reasonable yields. This makes the stock market less attractive, as the returns come at a higher risk.
The lower interest rates go, especially when the developed world moves in lockstep with the US, the more domestic and foreign capital is forced into the stock market in search of yield that at least keeps pace with inflation.
This is another bullish factor for the nominal returns of the stock market going forward. Yield-seeking investors have nowhere to hide.
Smart Money / Dumb Money Confidence
The SentimenTrader.com Smart/Dumb Money Indexes tell us dumb money and smart money’s level of confidence in the stock market at a given time. It’s an excellent indicator for spotting short to intermediate-term frothiness.
They define ‘dumb money’ indicators as small-lot futures speculators, Rydex mutual fund flow, equity-only put/call ratio, etc. According to SentimenTrader, these indicators have a poor track record at timing the market.
This is in contrast to what ST refers to as ‘smart money’ indicators; those are OEX put/call ratios, open interest ratios, commercial hedger positions, and stock/bond spreads.
According to ST, these indicators have a much better track record at market timing, and their moving is typically the result of smart, well-capitalized traders/investors.
The index shows us that smart money’s peak confidence was at the market bottom in March 2020, and has declined since then. Conversely, dumb money confidence was near historic lows at the market bottom, and only climbing since the really began.

Retail Investors Are Overconfident
‘You know it’s time to sell when shoeshine boys give you stock tips’ – Joseph P. Kennedy Sr.
It’s a classic Wall Street axiom: the little guy is always wrong. And right now, the little guys are hugely confident and betting the house on the market continuing to rise in a big way.
Retail traders have never been nearly this speculative. You may have noticed this in your personal life.
If your friends know you’re involved in the stock market, you’ve probably had folks who’ve never shown an interest in the stock market ask you how they can capitalize on all of the market crazes as of late.

The Manufacturing Sector Is Picking Up
The ISM released their report on manufacturing on the first of the month, with June showing a huge comeback for the manufacturing sector.
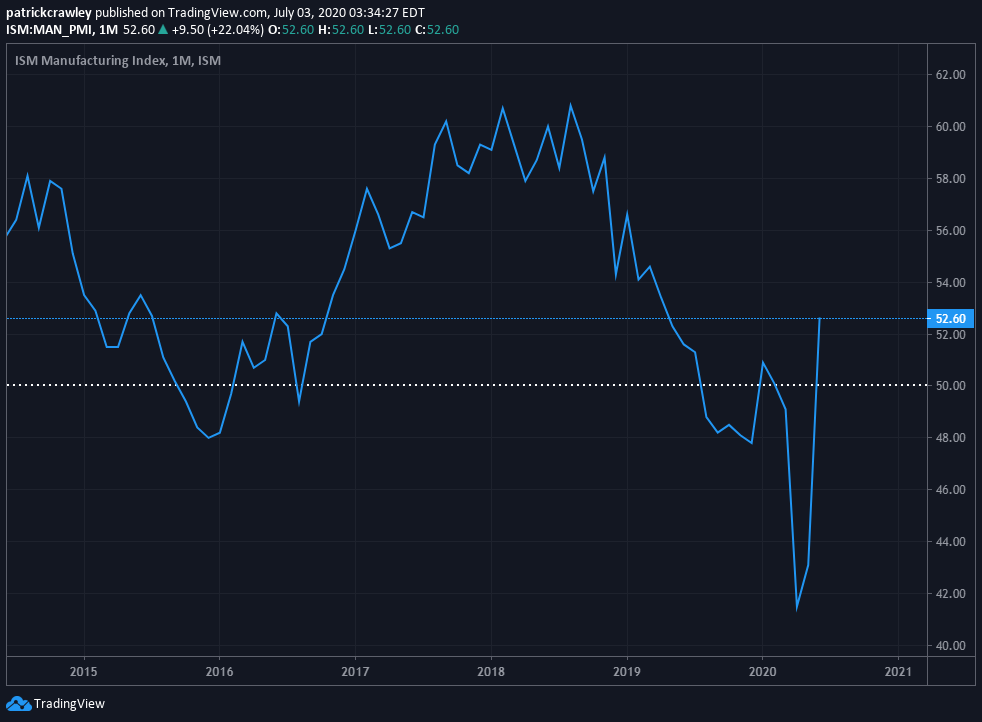
One of the most valuable parts of ISM’s report is the qualitative comments from purchasing managers across different manufacturing industries. The sentiment of the June report is overwhelmingly ‘things are recovering, but slowly.’ I suggest you read them yourself here.
All of the key indicators tracked by ISM are up for the month of June except for customer inventories and deliveries. Important indicators like new orders and
Bottom Line
You can go over to SeekingAlpha and find writers making bold proclamations from hyperinflation being imminent to historic economic growth. These writers will often reference factors like the ones I did in this article, using hyperbole and pontification to make the rest of their point.
None of us, not even Jerome Powell, know what tomorrow holds. All we can do is observe relationships between certain macroeconomic and market factors and make a common sense decision on how the stock market will discount these factors.
Today, the market looks pretty frothy; the Nasdaq is making all-time highs with the uncertainty of another lockdown looming over America. At the same time, however, the market is a future discounting mechanism.
Perhaps the market has priced in the likelihood of an additional lockdown and the magnitude of its economic effects on the price.