

“Sell and May and go away” refers to the Wall Street axiom related to the performance of stocks during the 6-months beginning May 1.
The theory states that if you reduced your stock holdings on May 1, and repurchased your portfolio on November 1, you would benefit from the outperformance during these periods.
May kicks off the unofficial start of the summer holiday season in the US which is Memorial Day to Labor Day. Historically, the volume of trading during the summer months of June, July, and August has been lower than the average monthly volume experienced outside the summer months.
People go on vacation and spend time away for the summer holiday’s which generally weighs on trading volume. The question is whether the lack of volume spill over into lackluster performance.
A seasonal study of the major US averages will help shed light on this question.
Seasonality Study
One of the best ways to determine if there is a negative performance during the May through October period is to perform a seasonality study. Seasonality, as it relates to performance, would be the presence of regular intervals of less than a year that show predictable patterns.
For example, you might assume that every year as the cold weather arrives in the Northern Hemisphere, heating fuel prices will climb.
The seasonal performance could exist for several reasons including the weather, holidays, and vacations. These seasonal tendencies are generally regular and repetitive.

The seasonality chart of the S&P 500 index shows the average returns during each month of the US benchmark S&P 500 index. The column chart shows that over the past 20-years the returns in May averaged zero, but 65% of the time prices were positive. The average returns:

Source: LPL Research
During the May through October period, the percent of the time that returns were positive peaked at 65% while the floor was 55%.
This means on average, the losses experienced on specific years during the May through October time frame were larger than the gains. 20 years is used to help smooth the returns in specific years that could influence the total for a given month.
For example, the seasonal return profile, of the 10-year chart, is slightly different, as July experienced huge gains in a few years, which influenced the returns in that month.
Over the 6 months beginning in May, the returns for the last 10-years are as follows:

Source: LPL Research
How Would a Sell in May and Go Away Strategy Work?
The real question is whether selling your portfolio every year in May and buying it back in November would outperform a buy and hold over a defined period. You can determine the results by analyzing the performance during the May through October period relative to the average performance for an entire year.
The returns from May to October over the past decade are listed above. The average returns during this period are 2.64%
If you started with a portfolio of $1,000 and invested it every May and sold it at the end of October, during the past decade, your compounded return is approximately 27%, which would increase your portfolio to $1,270.
The average returns of the S&P 500 index over the past 20-years are approximately 8%. If you removed the average gains of 2.6% during the May to October period from the average 8%, you would how positive returns of approximately 5.4% during the November to April period.
What might be more pertinent is whether there were more large negative returns during the May through October period relative to the November through April time frame.
While there were large declines in returns in October 2018 and August 2016, on average, the large negative losses appear to be equally distributed. December 2018 saw markets decline by 15% and March of 2020 saw the S&P 500 index declined by drop 13%.
Over time, since there are positive gains experienced during the May through October period, and selling your stocks would generate transaction costs as well as the potential loss of dividends, it does not appear to be prudent investment strategy to “Sell in May and Go Away” when evaluating the S&P 500 index.
The strategy appears to be even less opportunistic when evaluating the seasonal returns of the Nasdaq 100 ETF.
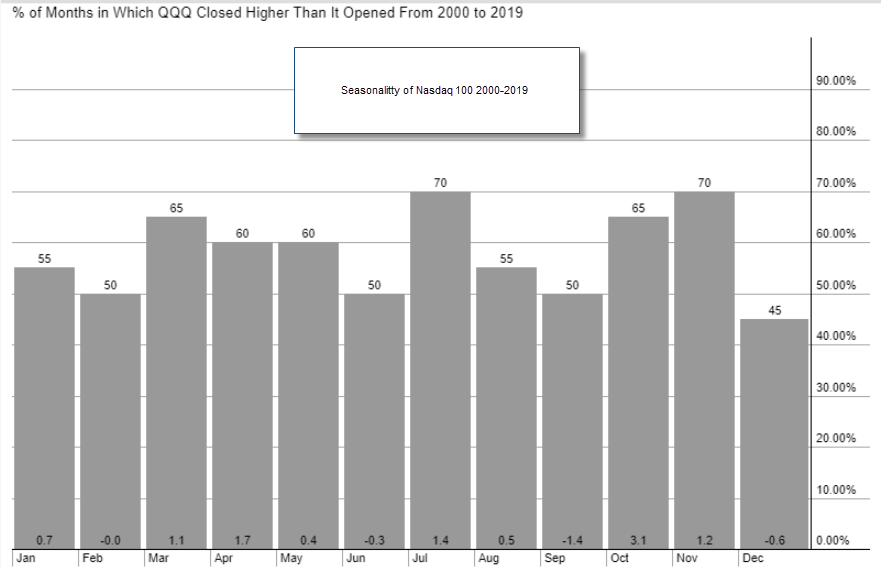
The historical returns of the QQQ Nasdaq 100 ETF show that the tech-heavy index outperformed during the July through October period. The largest monthly gains were seen on average in October, followed by April and then July.
Positive returns were seen in 66% of the months during the May through October period which was the same for the November to April period. The large declines during these periods were similar to the large declines the S&P 500 index experienced.
The returns that are observable for the Nasdaq 100 tell us that the return profile is different than the seasonal returns for the S&P 500 index. In measuring the Dow Industrials those returns are different than both the Nasdaq 100 and the S&P 500 index.
Bottom Line
The upshot is that there might be some stocks or indices that a “Sell and May and Go Away” strategy could be prudent.
If you perform a seasonality study on every stock you might be able to find some specific seasonal tendencies that would allow you to make money, relative to a buy and hold strategy.
This does not seem to be a beneficial trading strategy that can be used successfully on the popular US stock indices.
On average, the May through October period experiences positive returns on the major US indices but this will change depending on the asset that you evaluate.
The steady increase in technology shares in the months that follow quarterly financial results shows that there possibly be some seasonal tendencies during these months.