

If you follow the markets long enough, you’ll see that stock prognosticators and weather forecasters have similar seasonal predictions.
When the weather heats up in spring and our minds turn to the upcoming summer, the catchphrase for investors has been “sell in May and go away”.
Equity returns tend to outperform between November and April compared to May through October, but this is far from a certainty and may simply be a result of several historic market crashes, including the Black Monday crash in October 1987 (which saw the Dow Jones Industrial Average drop more than 22% in a single day).
The October Effect is another one of these seasonal patterns, coined likely due to the peculiar history of October market crashes.
The Black Monday crash in 1987 is the most prominent of these examples, but other examples exist as well.
In 1929, the Dow plummeted 11% on October 24th and then another 12% on October 29th, which kicked off the Great Depression and began a stock market decline that would take more than two decades to recover from.
Seasonal investing strategies are nothing new to the market.
Money managers have attempted to time their buying and selling based these seasonality traits for as long as we’ve had stocks and a calendar.
But many of these axioms have muddy data and are boosted by strong narratives based around unique events, like the 1987 crash. That leads us to the September Effect.
What is The September Effect?
The October Effect makes headlines and grabs attention because of the strong anecdotal stories attached to it. Is October a bad month for stocks?
How could it not be with crashes in 1929 and 1987, plus the Bank Panic of 1907 and descent of the Great Recession in the fall of 2008?
Well, for starters, those are just five Octobers in a 100-plus year span. If we look at all October returns in that time frame, the S&P 500 actually produces a positive gain.
Even when we include massive shocks like the Black Monday crash and beginning of the Great Depression, the data just doesn’t support October being the most dreaded month.
That title should really go to September. The September Effect might not be as popular a theory, but the data supports it far more than the October Effect. Over the last 25 years, the September returns of the S&P 500 have been negative.
And it’s not just a US phenomenon either. As Market Realist points out in this graph from Vichet Sum, September is historically the worst month for equities across the globe.
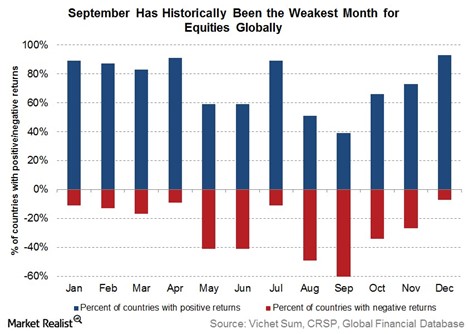
As you can see from the chart, the September Effect isn’t just a US market anomaly, but a global phenomenon that has affected stock markets all over the globe.
May and October might get all the notoriety as bad months for equities, but the data here shows that September is the month most likely to see a downturn in stocks, regardless of where in the world you’re investing.
What Causes the September Effect?
Like most stock market anomalies, the causes of the September Effect can vary depending on who you listen to and when you talk to them.
So what’s the real reason?
For a single month to have so much negative data attached to it, it can’t be just one single cause. No, there’s a couple different hypotheses behind the September Effect and many of them likely work in unison to produce the result.
Here are a few of the most popular:
- S. Election Season – September usually begins the media blitz for U.S. elections, which can cause many investors to reposition their portfolios for a potential power transfer or a Congressional shakeup. And while the September Effect isn’t limited to just U.S. markets, it’s difficult to argue that U.S. elections don’t have a significant ripple throughout the world.
- Seasonal Rebalancing – September marks the end of summer in the northern hemisphere as kids return to school, vacations end, and investors prepare for the final quarter of the year. Volume picks up in September as the summer winds down and many traders get back into their daily routine. Also, mutual funds may sell losing shares around this time in order to prep for tax loss harvesting and year end reporting.
- Market Psychology – This may be the most unsatisfying theory, but it’s also the most likely to be true. Why do stocks tend to fall in September? Because most investors think they will, so they sell in September. The October stock market crashes are well-publicized and investors may simply shed some weight in September to avoid a potential crash (despite evidence to the contrary that stocks rarely crash in October). Investors believing that OTHER investors believe in an anomaly is often all something like the September Effect needs to take hold.
Bottom Line
Stock market anomalies like “Sell in May” or the October Effect are often based as much on mythology and narratives as they are in hard data.
Stories about Black Monday in 1987 or the market crash of 1929 stick into the brains of investors far more rigidly than stats about average returns over a century-long period.
However, there is some data to backup the premise of the September Effect, which shows that on average, September is the worst month for equities across the globe.
But despite this trend, be cautious when trading around stock market anomalies. After all, they’re called anomalies for a reason – they don’t happen all the time and when they do, it’s difficult to formulate a reason why.
Many times, the September Effect is negligible on stocks and selling them only to buy back in October can rack up unnecessary transaction costs.
The September Effect might be real, but it’s not something worth basing an entire trading strategy around.