

Stock market indicators play an important part in the overall analysis of the market. Indicators are a reflection of traders’ moods.
If the sentiment is positive, indicators will be buoyant.
On the other hand, a lag reflects a dampened sentiment. These sentiments can also help you get an idea of the economy to some extent.
Day traders can also formulate their decisions based on stock market indicators.
In general, understanding the nuances of their composition and construction can be essential for making all types of trading decisions.
A very important technical indicator within the world of the stock market is the smart money index, or better known as “the SMI”. Many day traders refer to it as the “smart money flow index”.
This indicator is based on intra-day price patterns and traders usually use it to observe if there are divergences on the chart or confirm market trends.
So, what exactly is the SMI and how does it work?
What is the Smart Money Index?
The Smart Money Index was popularized by Don Hayes in the 1990s. It is a technical indicator that attempts to gauge what the “smart money” is doing relative to the “dumb money” in the U.S. stock market.
In this case, the terms “smart” and “dumb” do not necessarily correlate with trader intelligence. Instead, they are used to help differentiate traders who are predictive (smart) from those who are reactive (dumb).
The Smart Money Index suggests that day traders and investors ought to follow the “smart money” instead of the “dumb money”.
This indicator says that expert traders normally get into the market at the end of the day, when trades are less affected by emotion.
The idea here is that the majority of traders (news-driven, emotional) make their trades at the opening bell because of the overnight economic data and news.
On the other hand, the more experienced traders jump into the market the closehaving the chance to evaluate market performance. The difference reflects the net trading of these “smarter” traders.

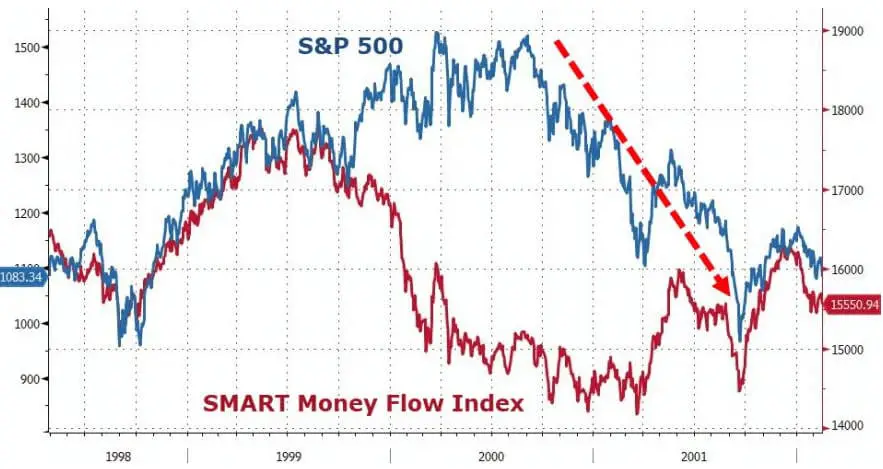
In the above example, you can see that smart money started flowing out of the market before the dotcom bubble popped. This is a good way to understand potential future market movements, especially if there is a divergence from smart money and market movement.
How the Smart Money Index is calculated
In theory, the Smart Money Index can be calculated for any stock market or market index. But the one that is frequently quoted in mainstream media is for the Dow Jones Industrial Average.
However, since the S&P 500 is a much better representation of the broader U.S. stock market, we have calculated the SMI for the S&P 500.
The Smart Money Index is calculated by taking the previous day’s smart money reading minus the gain or loss in the opening 30 minutes plus the change in the index during the last hour of trading.
Here’s how it’s done:
- Calculate the S&P 500’s nominal gain or loss during the first half hour of trading (9:30 a.m. ET – 10 a.m. ET)
- Calculate the S&P 500’s nominal gain or loss during the last hour of trading (3 p.m. ET – 4 p.m. ET)
- Today’s Smart Money Index = yesterday’s Smart Money Index – the market’s gain or loss in the first half hour of trading today + the market’s gain (or loss) in the last hour of trading day.
For example, let’s assume that the SMI’s value yesterday was 3,000. The S&P shed -55 points this morning and rallied +44 points this afternoon. The SMI’s latest value is now 3,000 – -14 + 8 = 2,994
Let’s take a look at another example. Assume that the SMI’s value yesterday was 3,000. The S&P gained +45 points this morning, and added +25 points this afternoon. T
he Smart Money Index’s latest value is now 3,000 – 45 + 25 = 2980.
How Day Traders Can Use the Smart Money Index
Day traders can use the Smart Money Index in two ways. First, they can use it to confirm the trend of a stock.
For example, if the stock has been moving in an upward trend, this indicator can caution you when the trend is about to change.
Second, they can also use it to identify a divergence; i.e. look if the market trends in a different direction than the Smart Money Index.
For example, if the stock price moves down while the SMI is moving upwards, it is usually a signal that the price could move higher.
In general, the Smart Money Index is considered too bullish if the market slumps during a session and it doesn’t. By contrast, it is viewed as a bearish indicator if the market rallies and the index lags behind.
However, it is important to understand that the SMI does not send very clear signal whether the market is bearish or bullish.
In addition, there are no fixed relative or absolute readings signaling about the trend.
Therefore, traders should to look at the indicator dynamics relative to that of the market.
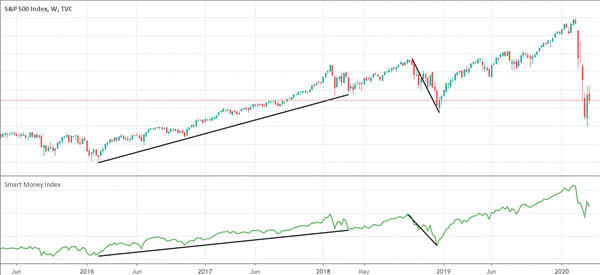
Here is a chart showing the indicator at work.
Why use the SMI?
The purpose of the SMI indicator is to gauge what the professional and experienced traders are doing in the market.
This indicator suggests that traders ought to bet on the direction of the stock market towards the end of the day since that is what the “smart money” is doing, and bet against the direction of the stock market at the start of the day since that is what the “dumb money” is doing.
During the market open, there is also a lot of buying on market orders and short covering.
Smart money tend to wait until the end, and they usually test the market beforehand by shorting heavily to gauge the reaction of the market.
These professional traders have an edge on all the other market players because they tend to have the best possible information available.
Therefore, the basic strategy is to bet against the morning market trend and bet with the evening market trend.
Bottom Line
The Smart Money Index is a straight line that typically moves along the price.
As mentioned before, this indicator is important because it gives an overview of the market and it can provide signs of trend’s reversal in case of divergence.
But unlike other indicators, the SMI does not send a signal of when to short, or when to buy. Instead, it readies you for what to expect in the near term.
Therefore, you should always combine it with others technical indicators like the relative strength index (RSI), the Parabolic SAR, and momentum.
Moreover, it is also advisable to take time to learn and practice with a paper trading simulator.