Stock Market Cycles and Momentum
One of the greatest challenges of day trading, besides learning to tolerate occasional losses, is learning to anticipate cycles of momentum. Over my years of trading I’ve noticed the distinctive cycles of momentum. During a hot cycle we will see small cap stocks giving back to back 100% movers. Stocks nearly daily going from $1.50-3.00, or $2.50-8.00. The questions we are going to answer here include: What causes these surges of buying and momentum? Why does momentum slow down or sometimes disappear? How can you predict when momentum will return? My answers are based on my experience as a trader and my experience working with thousands of students in our Warrior Pro trading courses.
What Causes Momentum & Parabolic Moves?
Before we can understand what causes momentum, I want to define momentum. In the stock market, momentum is defined by a strong trend (either to the upside or the downside). Momentum requires an imbalance between buyers and sellers and results in large percentage gains or losses. What would cause an imbalance between buyers and sellers? The cause is a catalyst, and the catalyst will always be either a technical breakout on the daily chart or breaking news. The biggest momentum stocks experience both catalysts simultaneously. When a stock has a catalyst, active traders see the potential for the stock to make a 20-30% move and start buying positions. That sudden increase in buying will trigger alerts on High Volume & Momentum stock scanners. Once other traders notice the alerts and see the stock has started to move due to a catalyst, they accumulate positions as well. As this point, we have to discuss the power of collective trading psychology.
The Collective Trading Community
The market moves because individual traders are buying and selling. Traders have the tendency of quickly jumping from one stock to another. Rapidly buying up shares of a stock surging up, then quickly selling those shares at the first sign of weakness. This pattern, fueled by fear and greed, when multiplied across the community of tens of thousands of active traders, creates massive spikes and pullbacks in stocks. In fact, this group mentality causes the same rips and dips in the overall market following breaking news from the Fed about interest rates. Although many traders will chase the initial breakout, buying a stock up 20% and holding it until it’s up 30% is a viable strategy. However, traders who missed the first entries and the second entries may still want to get a piece of the action and buy at irrationally high prices. What we begin to see is greed driving prices irrationally high. Although I rarely quote Alan Greenspan, he once said, the markets are self correcting. In the world of small caps, this is certainly true and it’s often true on a very short time frame. As we know it was true with the hosing market, but on a much longer time frame. When a stock gets to a point where it’s exceeding 50-100% in gains, traders who have been holding short positions begin buying to cover their losses while greedy traders continuing buying higher and higher. This increases buying and can result in a final explosion of parabolic price action where a stock will surge up 10%/minute. These parabolic moves often mark high of day volume and the highest price of the day. Parabolic moves are often followed by rapid pullbacks as traders who bought too high begin to feel fear and bail out, while calm and calculated short biased traders simultaneously take short positions after the volume of the parabolic squeeze has subsided.
Do Fear & Greed Drive The Markets?
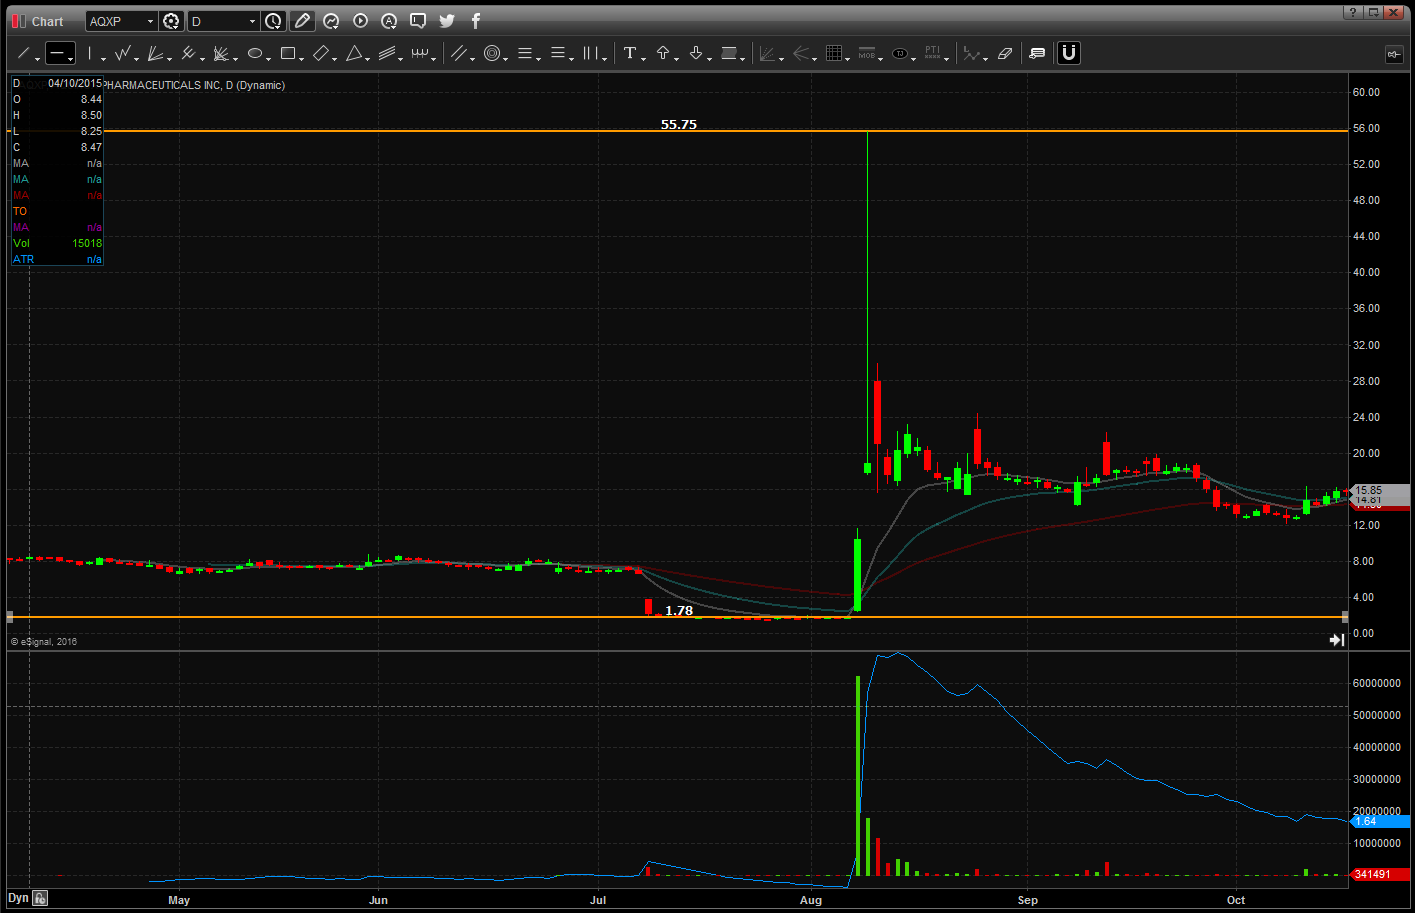
Clearly the market can be irrationally strong, and I believe greed combined with moderately good news can drive that strength. On the other hand, fear can cause those quick panic sell offs. In just 1 day AQXP squeezed from $20 per share to over $55 per share, then closed back in the teens. That was an incredible display of the collective trading community being greedy then fearful. These charts also represent opportunities to make tens of thousands or even hundreds of thousands of dollars by capitalizing on the volatility. The question is, do you know how to find your entries and your exits? This is something we discuss in both our Trading Courses and in our Free Day Trading Webinars.
Technical Breakout
A technical breakout is typically when a stock breaks out of a consolidation pattern, or an oversold pattern. A stock like Real Goods Solar ($RGSE) had been beaten up and oversold for a long time. At the first green candle to make a new high buyers started coming in. The opportunity to buy a stock right off the bottom offers low risk and big upside potential. Big upside potential is exactly what we saw as $RGSE surged from $2.50-8.00 in just 1 day. This momentum started as a technical breakout, and then was fueled by group trading mentality. Although technical breakouts don’t typically result in multi-day momentum in the same way that breaking news does, they still offer excellent opportunities for day trades or short term swing trades.
My Mid-Morning Profits on $RGSE


Breaking News Catalysts
A breaking news catalyst could include FDA approvals, completing Clinical Trials with amazing results, landing a new contract worth that will substantially increase revenue, partnering with a company like Google, Apple, or Facebook, an activist investor such as Warren Buffett or Carl Icahn taking a stake, or simply outstanding earnings results. Typically news is released just after the close, or just before the open, although occasionally big news will get circulated mid-day. As soon as I see a big headline, I have to ask myself if the news can cause the stock in question to gain momentum. In recent years we have seen stocks make 1000% or greater moves in response to breaking news. Being able to quickly interpret news and estimate the potential market reaction is what separates the winners from the losers.

What Type Of Stocks Gain Momentum
Some stocks gain momentum easily and can quickly move 20-30%, while others move very slowly. Imagine your car broke down on the side of the road and you need to get a tow. Some cars like a Prius are very light and will tow easily, while other cars like a school bus or a semi truck will tow very slowly. In the world of stocks, some stocks have high resistance to making big moves and others have very low resistance. The resistance in this sense relates to the number of outstanding shares available to trade. Each share available to trade adds “weight” to the vehicle, meaning it will move slower. A stock like Bank of America ($BAC) has a 10billion share float, while a stock like Real Goods Solar ($RGSE) has a float of under 1 million shares. In this comparison, $RGSE is a Prius and $BAC is a semi truck.
When we hear breaking news, one of the first things we want to check is the quality of the news and the float of the stock being effected by the news. If the stock has a low float (under 20million shares) that means a strong level of demand could easily move the stock 20-30% or even more. If the stock has a heavy float, it may not move at all. This means stocks with heavy floats are less volatile. That can make them safer for long term investors, but makes them very unattractive for day traders. As day traders, we hunt for volatility because that’s where we’ll find opportunity for profits. Each morning when I build my watch list of 3-4 stocks that could make big moves I start by looking for stocks that have already moved 5% or more on a headline or technical breakout. Then I prioritize the ones with lower floats and breaking news. When the market opens, I take my positions and watch my stock scanners to see if there are other stocks moving that weren’t already on my radar. All of my scanners are filtered to ignore heavy float stocks.
Hot Cycles In The Market
Following a big 300-400% mover, many stocks will become irrationally strong. This again, is a result of the collective trading mentality. Traders begin to think, if $RGSE can move 100% in 1 day, maybe so can this new stock that just popped up. Green encourages them to buy earlier, and take larger positions. Ironically, this becomes a self fulfilling prophecy because when you multiple increased buying over tens of thousands of traders thinking the same way, you have bigger moves. We typically see cycles where every stock that hits the high of day scanner will run 30-40% and we’ll see 100% movers on a near daily basis. Eventually, short sellers see a pattern which is that these stocks all fade back down since they are running without news and without good catalysts. As short sellers begin taking positions sooner and sooner, the stocks stop spiking up and the hot cycle comes to an end.

Cold Cycles In The Market
During a cold cycle in the market stocks that hit the high of day scanner have very little reaction. Traders are cautious, fearful, and don’t feel comfortable taking positions. If they do take positions, they are very small. Extended across the trading community we see a pattern of less buying, less volume, and fewer breakouts. Their fear becomes a self fulfilling prophecy just as their greed fueled more greed and more volatility. At some point, the cold streak ends. Typically during the cold periods stocks that spike up get shorted down immediately by short sellers. Eventually, a stock will spike up, get shorted back down, and then surge back up through the highs and force short sellers to cover their positions or stubbornly hold into the red. This begins an important shift. Now buyers are coming back into control. This is what we saw on $RGSE yesterday. The stock spiked up from 2.50 to 2.75, dropped down to 2.50 in the typically weak fashion, then suddenly surged back to 3.00, to 3.50, to 4.50, and to 5.50. And just like that, the momentum was back.
Final Thoughts on Momentum Cycles
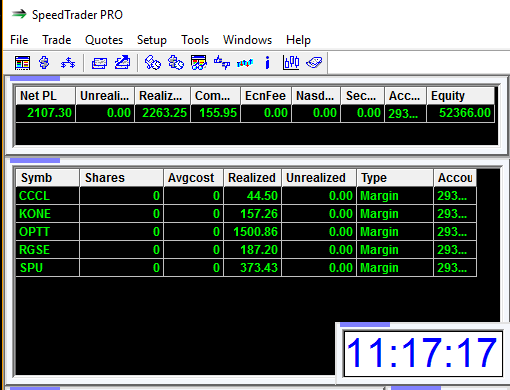
Do you think you should be aggressive with your share size during a hot cycle or during a cold cycle? (the answer should be obvious here!). Many traders use a technique of even position sizing, meaning they always take the same size positions. I instead use a technique where I use very large position sizes during hot cycles, an small position sizes during cold cycles. Essentially I’m putting the pedal to the metal when trading is hot then taking shelter from the storm when trading is weak. By doing this I’m able to make $30k on a strong month and then just $10k on a weak month. Note that even on a bad month, I’m still making money. I do everything possible to avoid going into the red. That means reducing my risk in response to the greater market. Every trader must adapt, and must have the sense of awareness to respond to overall market conditions. You are not trading in a bubble, we are trading with and against tens of thousands of other traders. Their behavior impacts or success or failure whether you like it or not. Yesterday we had a big mover on $RGSE and it broke a 2 week cold cycle in the market. Today we had 5 stocks surging up. These were moving in sympathy to the move yesterday on $RGSE. Short sellers were more fearful about taking short positions and long traders were greedy. The imbalance produced quick movers and I was able to get $2k with profits on 5 out of 5 stocks I traded. This for me, represents the time to be aggressive. When I’m green on 5/5 stocks I trade, it’s time to increase share size and capitalize on the strength in the market. When things slow down again and I’m finding myself red on 3/5 names, I’ll reduce size and patiently wait for the next catalyst and the next big mover.
Profits trading sympathy momentum the day after a big parabolic trade