

What Are Tick Charts?
Tick charts create a new bar every time a set amount of transactions are executed, unlike a time-based chart, which creates a new bar based on a fixed time interval. Many traders find these charts to be an effective way to reduce market noise, as each bar is created equal, with no low activity bars.
For example, each bar of a 1000 tick chart represents 1000 trades of any size. A tick can be a trade of just one contract/share, or 10,000 shares. This is why it’s crucial to combine the use of tick charts with volume.
Proponents of using these types of charts over time-based charts argue that time is static and has little to do with how the market moves. Seeing a few bars created in a short period of time on a tick chart is much more significant to them, as it demonstrates that significant volume is coming into the stock.
These charts are often used by S&P futures traders, in an effort to navigate the unforgiving whipsaw and fake-outs from algos they experience on time-based charts.
Why Use a Tick Chart?
On a time-based chart, there’s a huge difference between the opening bar, and a bar during lunch-time or after hours trading. Even though they both represent the same amount of time, the amount of activity that occurred during those periods are dramatically different.
Noise Reduction
The primary benefit of tick charts is that they decrease the noise present in a time-based chart.
During slow periods like pre-market or lunch-time (around noon EST), tick bars are very slow to form, because of the few transactions being executed.
Conversely, during active periods like the open and close, you might see several tick bars form in just a few minutes because of how much volume is being done. During these active periods, you’ll see micro-trends play out that on a time-based chart, only make up one or two bars.
Identifying When Smart Money is Stepping In
The great thing about combining the use of volume with tick charts is that each tick bar is equal. This allows you to see which price movements are supported by high volume, and which aren’t. It essentially tells you which trends are supported by smart money, and which ones are just retail money, making it likely to turn over.
Pre-Market and After Hours Smoothing
These types of charts are a great way to make sense of what is going outside of the market session. The volume traded during these hours is thin and fragmented, but combined, they make a few tick bars which can have some significance.
Here’s the difference of extended hours activity on a 15 minute chart vs a 233 tick chart:
15-minute chart:
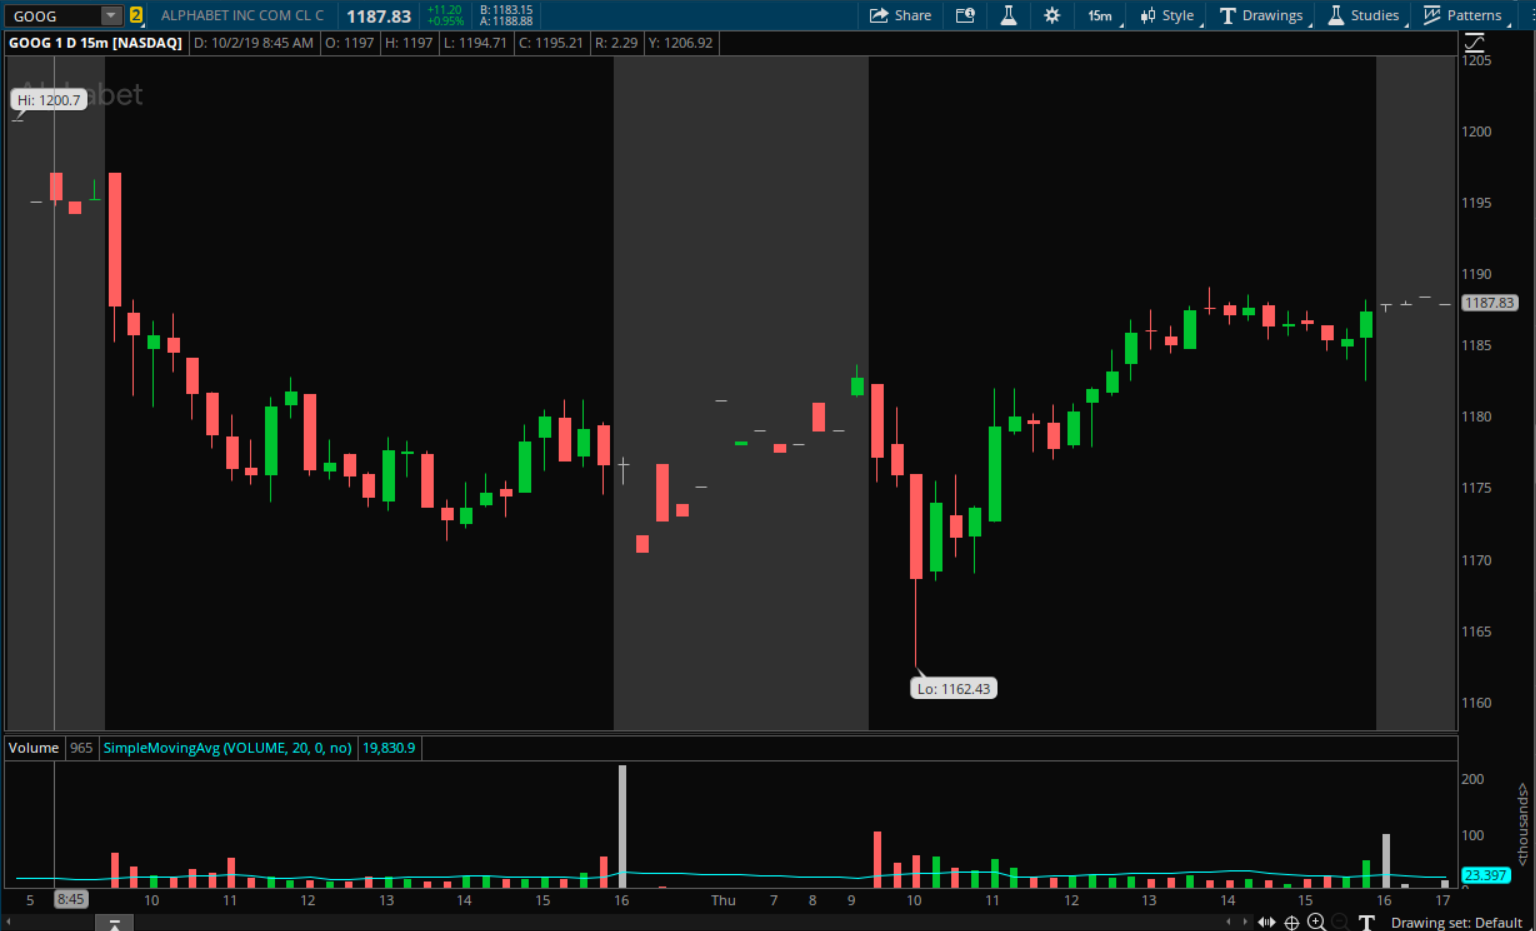
233 tick chart:

Recognize Trend Exhaustion
Markets go through periods of range expansion and contraction. In our piece last week about Marty Schwartz, we mentioned his use of T-Theory, the idea that markets spend the same amount of time trending as they do consolidating.
By making each candle’s level of activity equal, we reduce the chance of false trend continuation candles, which are really just low volume trading in the direction. Often times in these situations, once volume comes in, the trend reverses.
When To Use a Tick Chart
Many traders use a blend between several chart types. It makes sense to switch to a tick chart during slow, range-bound markets, where a time-based chart will just whipsaw you. Using a tick chart allows you to only make trades after a certain amount of market activity has happened.
When the markets are experiencing periods of high volume and volatility, tick charts make it simple to adjust. You simply choose a larger interval of ticks. Perhaps you use a 1000 tick chart, try a 2000 tick chart. On the inverse, during those lagging periods of low volatility that have characterized the later phase of the current bull market, it will become necessary to lower your tick chart interval.
Tick Charts vs. Renko Charts
Both tick and renko charts are based on price movement, rather than time or volume, although they do have some key differences.
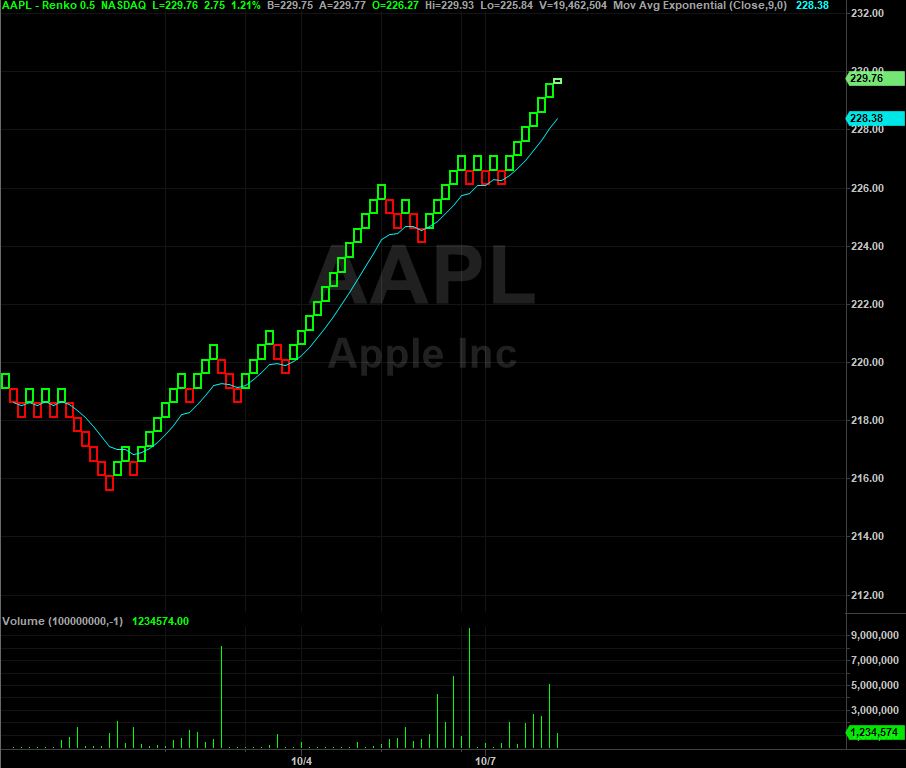
Renko charts focus on price direction. They create a bar for a given number price movement up or down. For example, you might program your charting platform to create a new renko bar for each time the market moves 10 points up or down.
A tick chart, on the other hand, are direction-agnostic. They’re only focused with activity, creating a new bar for every specific amount of trades, regardless of the direction.
Tick Chart vs. Volume Chart
A tick chart and volume charts are quite similar. They both create new bars based on volume activity, as opposed to price activity in the case of renko, and time activity in the case of time-based.
They differ in that volume charts create news bars based on the total number of contracts traded. A 1000 volume chart creates a new bar for every 1,000 contracts traded, regardless if it takes one or 500 trades to happen. A tick chart does basically the opposite. A 1000 tick chart creates a new bar every 1000 trades, regardless of how many contracts/shares were traded in those 1000 trades.
Tick Chart on ThinkOrSwim
Most platforms charge hefty fees for the inclusion of tick data, but ThinkOrSwim is one retail platform that includes it for free for all of their clients.
It’s easy to access a tick chart on ThinkOrSwim. Simply click on the time-frame setup at the top-right of your chart:

Then click on ‘tick’ in the aggregation type row:

Final Thoughts
Ultimately, tick charts represent a different way to display the same market data that you’d see on a time-based, volume, or range chart. Your preference for them will depend on your strategy and trading tendencies. A tick chart seems to be favored by scalpers, to eliminate the short-term noise.
Each charting style carries it’s pros and cons. During periods of high activity, your a tick chart may move too fast for you to react, while a time-based chart will offer a predictable stream of new bars. Renko charts will get you in some really long-term trends, but will also whipsaw in and out of trades several times due to false signals. Time-based charts can fool you with the low volume candles that don’t carry much significance.
Tick charts are a useful tool to have in your toolbox, even as a swing trader. Many intraday or daily chart swing traders have admitted to using short-term tick charts to find good entries. It’s all about using analyzing multiple time-frames.