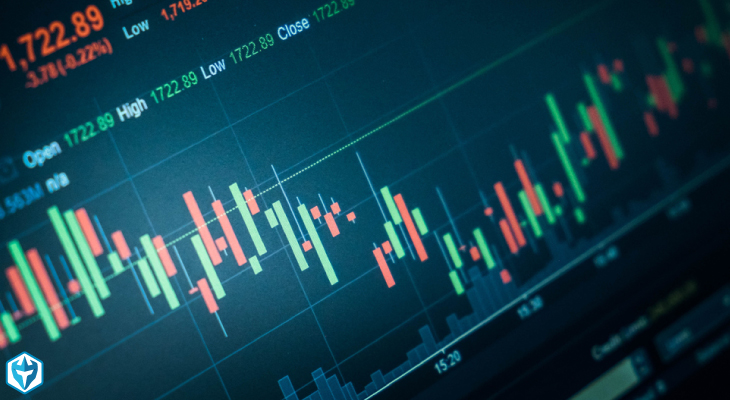
Candlestick charting is one of the most effective ways of interpreting prices and emotions of other traders when trading stocks. Knowing how analyze candlestick charts can help a trader to determine whether a trade is likely to be profitable or not.
Candlestick charting primarily highlights price movements of a currency, derivative, or security over time. This style of charting is mostly used in combination with volume bar-charts for technical analysis of patterns and stocks.
What is a Volume Candlestick?
A volume candlestick is a technical analysis indicator that combines the standard components of a candlestick along with volume, creating wider or thinner candlesticks depending on the timeframe chosen. The composition and color of a candlestick provides additional information to traders about the momentum and direction of a stock.
The rectangle is sized to indicate the difference between the opening and closing prices. The length of the top wick shows the difference between the high and the opening or closing price, while the length of the bottom wick marks the low price.
If the stock price rises during the day, the body of the rectangle is darkened to indicate that the upper horizontal body line is the opening price while the lower horizontal border line is the closing price. Alternatively, a white or red body indicates a higher closing price. The upper body line is the closing price while the lower body line is the opening price in this case.
Origin of Candlesticks
Candlesticks were first used by Japanese rice traders in the 18th century after realizing that human emotions could play a part in the direction of a market. The traders created candlestick charts to display daily price movements in order to visually represent those emotions.
Trading Volume Candlesticks
The width of a candlestick offers extra dimension of information. The lower the trading volume, the skinnier the candlestick body. A higher-volume days result in wider candlestick. Chartists also plot volume at the bottom of a chart as a series of rectangles.
A green volume bar is a higher-price trading session and a red bar is a lower-price trading session. Traders who plot candlesticks everyday look for various patterns and shapes to indicate the expected movement of stock prices.
A candlestick’s width represents volume that has been normalized to indicate its percentage of a lookback period. For instance, if you used a three-month lookback, the width of each daily candlestick would represent the day’s volume as a percentage of the three-month volume.
When a stock closes in relation to the range, traders can analyze candlesticks to know who is winning the war between sellers and buyers. If a stock closes at the bottom of the range, we can conclude that sellers showed more aggression and were willing to exit at any price. On the other hand, the buyers were only willing to buy at low prices hence causing the stock to fall.
If a stock closes at the top of the range, we can conclude that buyers showed more aggression and were willing to enter at any price. Meanwhile, the sellers were only willing to sell at high prices thus causing the stock to rise.
Wide Range and Narrow Range Candlesticks
Candles can be classified in two categories: narrow range candles (NRC) and wide range candles (WRC). Narrow range candlesticks indicate that there is low volatility/little interest in the stock, while wide range candlesticks indicate that there is high volatility/high interest in the stock.
Narrow range candlesticks form when volume is low, while wide candlesticks form when volume is high. Narrow range candlesticks imply low volatility – a period of time when traders show very little interest in a stock. With this in mind, it makes sense to enter a stock during periods of low volatility and getting out during periods of high volatility.
Wide range candlesticks form when volume is high – a period of time of traders show high interest in a stock. Therefore, you can look at volume candlesticks to determine the interest of either the sellers or buyers and trade in the direction of the trend. You want to know if a stock is attracting interest and whether institutional traders are accumulating or distributing it.
Final Words
When you are reading candlestick charts, what you need to know is why the candle looks the way that it does. If analyzed correctly, candlesticks can help traders to know who is in control of the market between buyers and sellers, as well as to gauge their interest in a given stock.
By watching the true price action of a stock in simple formats such as volume candlesticks, you may be able to hold winners for longer and sell losers faster.


