

One of the growing trends in the US equity market since around 2016 is an increased concentration in the top components in equity indexes, namely the Big Tech firms like Apple, Amazon, Facebook, and Google.
As you can see in the chart below, the weight of the top 10 S&P 500 components increased from around 20% in 2016 to 31.5% today.

Image credit: JPMorgan
Equity Indexes Don’t Tell The Whole Story
So a naive investor who just read their first “retire early” finance book might think that buying an S&P 500 index fund gives them an extremely diverse portfolio spread evenly among hundreds of stocks. They might be surprised that just one company, Apple, accounts for roughly 7% of their portfolio. Shouldn’t Apple account for just 1/500th of their portfolio?
Well, imagine their surprise when they find out that just the top 10 largest stocks in the index make up more than 30% of their portfolio.
That’s the part that could be potentially misleading about using these indexes to represent the average stock’s performance. Because increasingly, they do not.
You see, stock indexes like the S&P 500 and Nasdaq 100 aren’t equally weighted. In other words, the largest company in an index (say Apple, for example) will not have an equal weighting in the portfolio as the smallest stock in the index.
These indexes are weighted by market capitalization. So the more the company is worth, the higher their weighting in the index.
Because stocks like Apple, Google, and Microsoft have become massive trillion-plus dollar companies, they have huge weightings in these indexes. Their respective stock price movements have an outsized influence on the index’s performance compared with the average stock.
For example, suppose that the S&P 500 index advances 5% in one week. Just looking at the index returns, you might conclude that the 5% is normally distributed across all 500 index components. However, that is increasingly not the case in today’s markets.
Just as easily, some of the top Big Tech components like Apple and Microsoft could have reported bullish earnings, significantly pushing the prices of those stocks up while the rest of the index, excluding the top components, have actually declined in price on the week.
So, if we conclude that looking at the price of a top stock index like the S&P 500 isn’t the best way to measure the average stock’s performance, what’s next? This brings us to the subject of this article: market breadth.
What is Market Breadth?
Breadth is defined as “wide range or extent.” In other words, market breadth measures how widely all stocks participate in a market move.
If the market is rallying, you might analyze the market breadth to see if a small number of large companies drives the rally, or if the majority of the stocks are along for the ride.
This is important because it’s very fragile when a few stocks lead a rally (or correction). Weakness (or strength) in any of them can crumble the market move. But on the other hand, if all the stocks are moving together, that indicates a true shift in the economy.
Examples of Market Breadth
Fortunately, market breadth is something we can quantify with numbers relatively easily.
One such example is simply looking at the number of stocks that went up over a given period and subtracting from that the number of stocks that declined over the same period. A positive number means that more stocks are rising than falling.
This measure is known as the Advance-Decline Line, and the calculation is available in most charting software and freely available online.
Below is a chart of the 20-day moving average of the NYSE Advance-Decline Line in black with a 20-day moving average of the S&P 500 ETF (SPY) in blue.
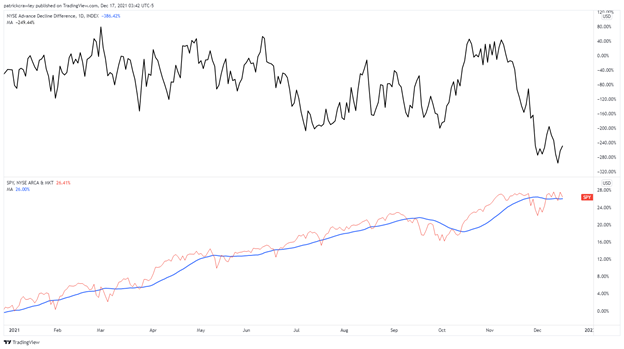
As you can see, the S&P 500 is making new highs while the Advance-Decline Line is declining, indicating weakening market breadth. This tells us that the recent rally driven by the December FOMC meeting isn’t supported by the majority of stocks.
This is market breadth in a nutshell. Taking a holistic view of the broad market like this can give us insights that vanilla technical analysis simply cannot.
Some other examples of market breadth indicators are:
- Return distribution across a stock index
- Comparing an equally weighted index to a market cap-weighted index
- Tracking the number of stocks at 52-week highs vs. 52-week lows
- The number of stocks trading above or below the 50 or 200-day moving average
And so on.
A Tale of Two Markets
By nearly any metric, market breadth and the price action of the S&P 500 don’t tell the same story. Measures of breadth like the Advance-Decline Line, 52-week highs minus lows, and so on show weakening breadth as the S&P 500 makes new highs.
So what are we to conclude from this?
Is any rally in the market doomed to fail unless it has broad support? Not exactly.
This has been the case many times throughout this bull market, and the market has continued to make new highs unabated.
But consider the story that this divergence is telling us. It’s a tale of two markets where the winner takes all, a true 80/20 situation, where 20% of stocks are responsible for 80% of equity returns.
And those winners have been large-cap tech stocks like Apple, Microsoft, Google, Nvidia, Tesla, and the like. For a good reason, too, as even though they’re massive companies, most of them are still putting up growth that would resemble a far less mature peer.
This division is buoyed by an avalanche of passive, blind dollars being invested into equity markets, continuing to buy a disproportionate amount of the largest companies, perpetuating the index concentration. It’s like momentum investing. The bigger companies get bigger because there’s blind money buying them without regard for valuation. The rich get richer.
Market Breadth Is Really Weak Right Now
Essentially, the weakness in most stocks is being disguised by the spectacular outperformance of the mega-cap Big Tech names that are top components in the S&P 500.
One way to view this phenomenon is to neutralize the outsized influence that these names have on the index’s performance using an equally-weighted index. This way, the returns of small components like Western Union (WU) and The Gap (GPS) get equal weightings to the behemoths like Apple.
Below is a spread chart of the S&P 500 Equal Weight ETF (RSP) vs. SPY going back to 2016, when the “tale of two markets” really kicked off.
When the chart goes down, that means SPY is outperforming RSP, and vice versa.

Looking at recent history, one metric which shows staggering weakness in breadth is the number of stocks making 52-week highs minus those making 52-week lows.
A clear pattern of lower lows and lower highs; a trend that recently made a new significant low.
An increasing number of stocks are failing to get up off the mat after being knocked down, all the while the mega-cap Big Tech stocks continue their march to adding another trillion to their market cap.
Bottom Line
While the same statement could have been reasonably (and wrongly) muttered five years ago, the FAANG stocks can’t carry the market forever. Project their recent performance into the future, and they’re worth 100% US GDP in a handful of years.
And that’s not to say there are no signs of strength in the market right now. There’s relative strength in the homebuilders, healthcare, and utilities. But sustained sector rotation away from Big Tech has been fleeting since the pandemic.