

The S&P 500 is still whipsawing within the range between 4300 and 4800, making any near-term action within this range suspect until one of these levels is cleared with considerable momentum.
SPY closed out 2022’s second trading week down 0.3%.
US trading is closed on Monday, in observance of Martin Luther King Jr. day.
Before we move onto the upcoming week, let’s quickly review the key events last week:
- Two Senators introduced a bill to ban members of congress from trading individual stocks
- StubHub is looking to public through a direct listing
- The Supreme Court blocked the Biden Administration’s vaccine requirements for employers, while upholding a vaccine mandate for healthcare facilities.
Price Action
The S&P 500 closed the week up 1.2% in the regular session in a week of whipsaw price action. Here’s a 30-minute chart of last week’s price action:

Looking to the daily chart, two candlesticks jump off the page, marked by red arrows:

The first represented a failed pullback pattern. SPY rallied hard, and then consolidated in the top 20% of the rally’s range–a textbook continuation pattern. However, the pattern failed with strong counter-trend momentum. At this point, some downside continuation is typically expected, however, few bearish patterns can resist the power of BTFD in today’s market.
The second bar occurs after SPY attempts to rally off its lows and is quickly rejected. This indicates heavy short-term overhead supply.
While these candlesticks are telling and definitely created short-term trading opportunities, the daily chart has yet to choose a direction and is range-bound; making discerning the next direction a bit of a crap-shoot.
Economic Data This Week
It’s a pretty soft week for economic data, with the biweekly housing starts/building permits and initial/continuing unemployment claims.
Here’s what Housing Starts and Building Permits have been up to lately:

Source: Briefing.com
US home prices are benefitting from an increase in input costs and a dramatic shift in migration patterns–namely a shift away from large cities into suburbs and rural areas. It’s getting a jump on how these trends are playing out that will give you an edge and not following the trend of government data releases. These should simply serve to confirm or deny your thesis.
And here’s what the unemployment numbers have been up to:

Source: St Louis Federal Reserve
Earnings This Week
It’s Q4 earnings season and we’re hearing from plenty of large and mega-caps, particularly in the financials and airlines.
Notable Releases:
- Tuesday, January 18:
- Wednesday, January 19:
- Thursday, January 20:
- Friday, January 21
- Netflix (NFLX)
Netflix’s upcoming report is a pretty big deal because it’s the first “tier-one” report of this earnings season, and could serve as a bellwether for the rest of the media industry stocks.
The primary KPI that moves Netflix (NFLX) stock is their subscriber count. There are two interesting factors at play here that could sway the incoming subscriber number:
- Netflix’s recent price hike
- Squid Game
You might be thinking, “Netflix raised their prices in Q1 ‘22, this isn’t captured in the Q4 ‘21 report,” and you’d be correct. However, many view a price hike prior to an earnings report as a signaling mechanism, because subscriber growth is potentially slowing and they have to make up the revenue growth by raising prices. This might be reading the tea-leaves a bit too much, but it’s worth noting.
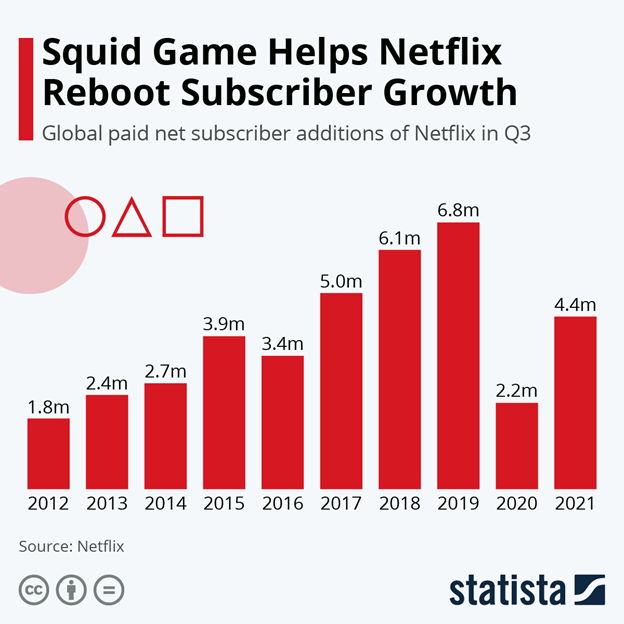
Squid Game is an international hit that spans across languages. It’s the biggest series launch in company history, ranking first in 94 countries. The show has already helped Netflix reboot subscriber growth in Q3 ‘21, and even modest international growth coupled with this hit could give investors the confidence to give the stock a bid again.
Current trends, however, look pretty bearish for this earnings report, as app download trends were down in December.
When it comes to trading, playing Netflix earnings is a favorite among options traders, especially those who love to short volatility, as historically, earnings volatility in Netflix has been overpriced.
Here’s a quick look at the earnings picture for Netflix over the last several quarters:

For their upcoming Q4 ‘21 report, the Wall Street consensus EPS is $0.83 per share, while the Estimize consensus (crowdsourced estimates) is $1.02.
The stock is amidst a serious selloff, currently logging a 14-day RSI of 23, its lowest reading since 2014. Intense bearishness is baked into the stock and even a slight surprise could mean a vicious rally.
