

For a large portion of the investment industry, market volatility is a scary element to consider. Buy-and-hold investors don’t like seeing their stocks whipsaw around and the financial media is quick to bring the fear whenever markets move frantically.
But is volatility really that harmful to your portfolio? Don’t believe the CNBC hype – volatile markets aren’t unhealthy and stocks moving rapidly is just a way of life in a capitalistic society.
In fact, if you’re a day trader, volatility is your best friend. While long-term investors fear volatile markets, day traders can use volatility to create opportunities that don’t exist when markets are steady.
In this post, we’ll discuss what volatility is, what causes it, and how shrewd traders can use it to their advantage.
What is Volatility?
Stocks have provided steady returns over the last few decades, but day-to-day trading has been anything but consistent. Markets respond to many different factors and prices can gyrate wildly in the short-term.
Economists use volatility to measure these gyrations.
By definition, volatility is the range of returns over a specified time period compared to the average return. Volatility attempts to measure the unpredictability of stock returns while ignoring direction and trend.
Volatility measurements don’t care if a stock is up or down – only the variance in price in relation to the mean.
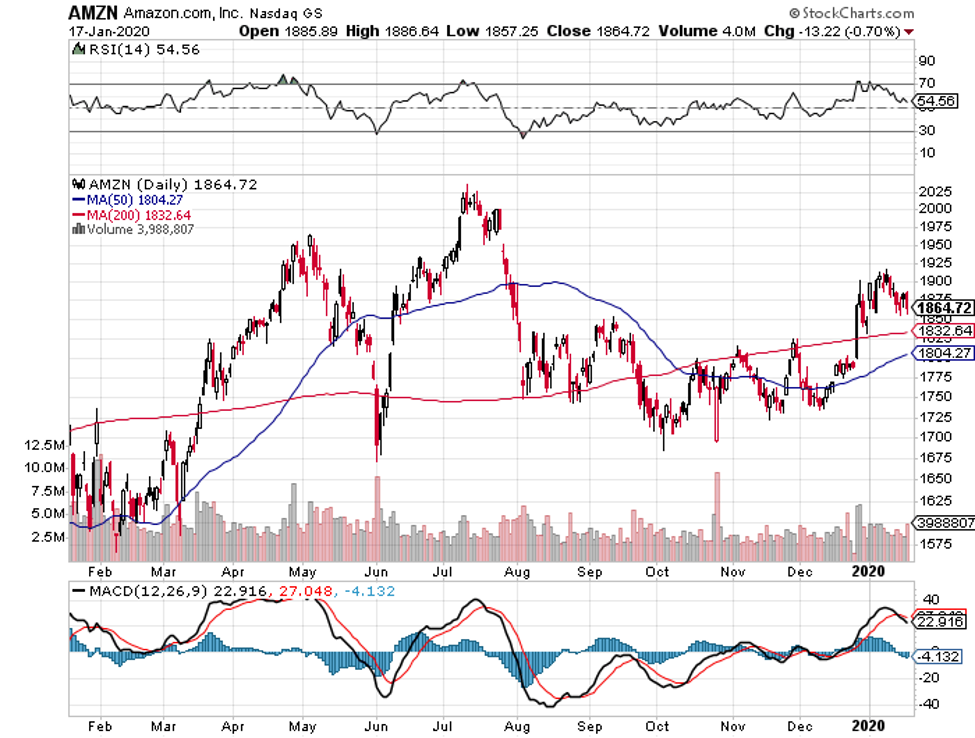
For example, Amazon stock gained 21% in 2019, but prices didn’t follow a straight path up. The stock was up 30% by July but then dropped 20% and traded in a tight range through November.
As Christmas approached, the stock broke out it’s range and finished the year up 21%. So while long-term stock holders were happy with the annual return, day traders who held the stock until summer and shorted it until Thanksgiving took home much greater gains.
Volatile stocks are the day trader’s bread and butter because they provide so many chances to profit compared to stocks locked in a trend.
How is Volatility Measured?
We discussed above how volatility is measured using standard deviations from an asset’s average price of a specified time period. But market participants also measure volatility using different instruments depending on the asset or market in question.
Volatility Index
One of the most popular volatility measures is the VIX index from the Chicago Board Options Exchange (CBOE). The VIX measures implied stock market volatility over a forward-looking 30-day period using the strike prices of S&P 500 call and put options.
Established in 1993, the VIX is now known as the Fear Index and is globally recognized as one of the best predictors of volatility is US equity markets.

If the VIX measures implied market volatility as a whole, beta attempts to gauge the volatility of an individual security compared to its peers. Traders use beta to identify volatile stocks by comparing how much they gyrate in relation to the market as a whole.
The beta of the market will always be measured as 1 – this represents the systemic risk involved with all stocks in a market. A stock that moves up and down more wildly than the overall market will have a beta higher than 1, while stocks less volatile than the overall market will be lower than 1.
Growth stocks like Apple (1.31) and Amazon (1.59) have high betas while utilities like Duke Energy (0.10) and health services providers like United Health (0.67) have low betas. Day traders looking for volatility seek out high beta stocks.
Bollinger bands are another helpful technical tool for measuring volatility. Bollinger bands are three lines set by an asset’s 20-day moving average, one standard deviation to the positive side, and one standard deviation to the negative side.
By using standard deviation, bollinger bands measure volatility by shrinking when prices are steady and expanding when prices are fluctuating.

What Factors Affect Market Volatility?
Uncertainty breaks tranquil markets like Patrick Mahomes breaks NFL defenses. When the world moves on a predictable path, market prices are steady and volatility is stifled. But when the unexpected happens, volatility spikes as investors get nervous and trade volume accelerates.
Uncertainty comes in many forms: a missed earnings report, a surprise election result, or a catastrophic weather event can all make investors nervous. Here are a few of the biggest factors responsible for volatility spikes in the market:
- News – Political events, scandals, and inclement weather can have reverberating effects on market volatility. When Donald Trump won the presidency in an upset in 2016, stock futures bounced around wildly deep into the early morning hours. Stocks like Wells Fargo and Facebook saw steep declines followed by recoveries when their various scandals were making headlines. During Hurricane Harvey’s onslaught of Texas, energy and insurance stocks dropped while home improvement stocks saw impressive gains.
- Economic Data – Each month, the federal government releases data to show how well (or poorly) the US economy is doing. Some of these key data points include consumer spending, inflation, jobless claims, GDP, housing starts, wage growth, and retail sales. Most of these reports are baked into stock prices before the data is released and have little effect on the markets. However, when the numbers don’t back up the expectations, stock prices can swing violently.
- Earnings Reports – Many traders listen carefully to the quarterly conference calls given by publicly traded firms for hints about their future growth. Earnings beats can send stocks higher while misses drag them down. However, the key aspect here is guidance – forward-looking statements about the company’s future prospects. Important guidance numbers include revenue, capital expenditures, and projected profits. A company that beats earnings estimates but lowers guidance will be in for some choppy trading sessions.
- Interest Rates – Few things influence the markets more as a whole than interest rates. Interest rates influence how much we pay to use financial products like loans and credit cards. The most influential interest rate is the federal funds rate set by the Federal Reserve. The fed funds rate helps the Fed control growth while also setting the rate banks use to lend to each other. High interest rates usually send stocks lower and vice versa.
- Technical trading signals – Sometimes volatility increases in a certain asset because it reaches a key technical trading level like support or resistance. Automated trading programs use these signals to trigger buy and sell orders. When a stock hits a key level like the 50-day moving average, it often sparks a flurry of trading activity.
Current Volatility in the Market
While certain sections of the economy have been slow to recover from the Great Recession, the stock market hasn’t been one of them. In the last decade, stocks have delivered superior returns for buy-and-hold investors. Day traders looking for bargains have had to dig deep into the charts.
Using the VIX as a measure, market participants are currently experiencing one of the least volatile periods in US history. Now 10 years removed from the last recession, the VIX has continued to make lower lows, even dipping below 10 for the first time since early 2007.
Events like Brexit and the 2016 US election have caused some VIX spikes in recent years, but stocks have been on a relatively smooth path since the crisis.
Volatility Provides Opportunities for Day Traders
Volatility is a sign of healthy markets in both the long and short-term. Buy-and-hold investors may not enjoy watching their 401ks move wildly during periods of uncertainty, but that volatility is necessary for outsized returns.
Systematic risk in the market cannot be removed or diversified away. But that risk is precisely WHY stocks deliver better returns than safer assets. Investors need to be rewarded for taking on risk and those rewards come in the form of higher returns.
Day traders can make use of volatility in the short-term too. By leveraging technical factors like beta with tools like moving averages, traders can find volatile stocks and identify ideal entry and exit points for trades. Volatile stocks can provide daily opportunities – take the Beyond Meat or Tilray crazes for instance.
If you’re a day trader, the direction of the move is irrelevant. It’s all about the range of returns and whether the trader has the eye to spot the volatile asset.
This is why tech companies and stocks with a recent news catalyst are favored by day traders because they can have large intraday moves compared to companies like Bank of America.
Another tool day traders will look is the average true range. This will tell them how much a stock moves a day on average. Typically, we will like to see a higher ATR, over $1 is good.
Bottom Line
Volatility is good for markets.
In the long-term, volatility supplies the risk necessary to reward investors with high stock market returns. As the saying goes, no risk, no reward. In the short-term, volatility may frighten some market participants thanks to scary headlines and predictions of doom.
Day traders can ditch the hyperbole though. Volatility shouldn’t be feared if you trade every day; it should be embraced!
Volatile stocks provide far more opportunities for profitable trades than flat ones, regardless of the direction of the current trend. Volatile stocks can be bought on the upswing, sold short on the downswing, and repurchased on the next upswing – sometimes all within the same afternoon.
Remember, volatility is your friend regardless of your trading strategy. But for day traders leveraging technical analysis, volatility isn’t just a friend. It’s a trusted ally who you hope never strays too far away.