

- Understanding What RSI Actually Measures
- Why Extremes Matter for Day Traders
- How I Use RSI To Filter Out Bad Breakouts
- Using RSI To Confirm Momentum Strength
- Where RSI Really Shines: Reversal Trading
- Recognizing Overbought Reversals
- Recognizing Oversold Reversals
- Why I Avoid Mid-Range Reversals
- Layering Bollinger Bands With RSI
- When I Don’t Use RSI
- Conclusion
Watch Full Video Here: The Ultimate Relative Strength Index (RSI) Trading Strategy
While I don’t find myself using the Relative Strength Index (RSI) too often for my day trading strategy, it’s a good indicator to understand for traders looking to continue to build their knowledge. It is one of the simplest indicators, but it can be incredibly effective when timing reversals or double-checking the strength behind a breakout.
In this guide, I’ll walk you through how I use RSI for day trading, where it helps the most, and how combining it with other tools can improve accuracy.
Understanding What RSI Actually Measures
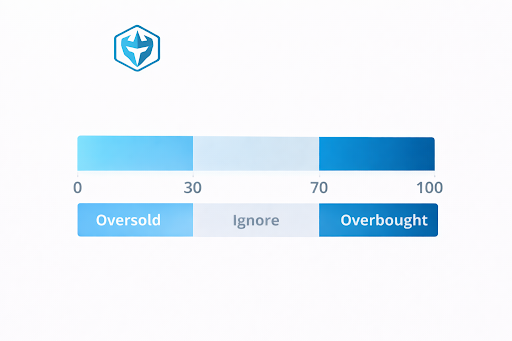
RSI is an oscillator that moves between 0 and 100. Most of the time, it stays inside that range. When it pushes to extremes, that’s where things get interesting.
The upper boundary at 70 marks overbought conditions, and the lower boundary at 30 marks oversold conditions. Anything in the middle doesn’t offer much tradable information for me.
If the relative strength is 100, it can’t really get any stronger, and more likely than not, we’re going to see a correction pretty soon. What matters is the story RSI tells about momentum.
When RSI is near 100, the stock is incredibly strong, but it also “can’t really get any stronger,” which means a correction may be coming soon. When RSI approaches 0, the stock is extremely weak, and while it might hold weakness for a bit, the bounce can be significant once it forms. These extremes are where volatility expands.
Why Extremes Matter for Day Traders
RSI isn’t something I look at constantly during every move, because most of the time it’s just floating in the middle of its range. I only become interested when it reaches the top or bottom bands. Without that, reversals often don’t have enough range to justify the risk.
When RSI is above 70 or below 30, I know:
- The stock is stretched and may be nearing exhaustion.
- Volatility is likely higher.
- Risk-to-reward improves dramatically.
This is why I tell beginners not to rely on RSI signals in the middle of the range. That’s where chop lives, not opportunity.
How I Use RSI To Filter Out Bad Breakouts
One of the strongest signals RSI gives me is divergence. Divergence happens when price and RSI start disagreeing with each other. The stock pushed back up to test 5.50, but RSI didn’t make a new high. Whenever that happens, I pay extra close attention.
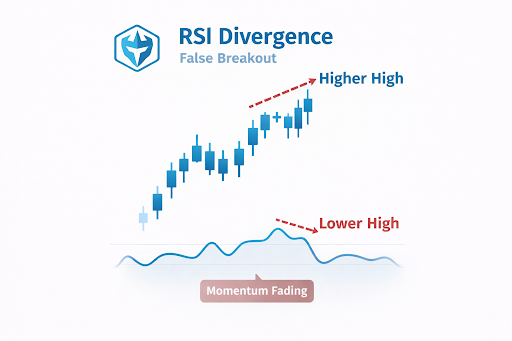
Divergence typically shows up during potential false breakouts. Price is attempting to reclaim the high, but momentum is fading behind the scenes. When I see this, I pause immediately and reevaluate. Whenever that happens, I pay extra close attention and take the signal from the RSI that this is more likely to be a false breakout.
Some confirming clues I look for:
- A steep pullback before the second attempt
- MACD crossing negative or converging
- A double-top shape forming
- Volume thinning out on the breakout
When these line up with RSI divergence, I stay out. That was the case in the example where the stock pushed to 5.50 twice. The move looked decent on the chart alone, but the RSI told a different story. That helped avoid a losing trade.
Using RSI To Confirm Momentum Strength
On the other hand, RSI can also support a continuation setup when the price is trending well. A high RSI reading isn’t a sell signal by itself. Sometimes, a stock can grind higher with RSI sitting above 70 because the trend is strong and supported by increasing volume.
I look at the slope of RSI:
- If RSI is rising with price, that supports the momentum.
- If RSI is flattening or falling while price makes new highs, something is off.
Where RSI Really Shines: Reversal Trading
A lot of beginner traders gravitate toward reversal setups, and RSI is one of the best tools to confirm whether a reversal is ready. A single extreme reading isn’t enough to enter a trade, but when RSI pairs with the right price action, the opportunity becomes clearer.
Recognizing Overbought Reversals
An overbought reversal typically forms like this:
- RSI reaches or exceeds 80
- Price pushes to a new high
- RSI fails to make a new high (bearish divergence)
- A topping candle forms
- MACD begins converging
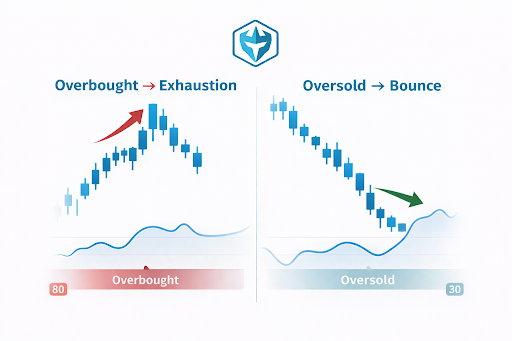
That combination often signals that buyers are running out of strength. For example, once RSI peaked and pulled back, the next push higher didn’t match the RSI level. That’s when I start looking for the reversal.
Recognizing Oversold Reversals
Oversold setups work the same way, but in the opposite direction:
- RSI dips under 30
- Price extends outside normal ranges
- Candles may stretch below lower Bollinger Bands
- A shift in momentum forms with a strong first green candle
I don’t simply buy because RSI is low. I wait for the market to show that the reversal has begun. One strong candle after a stretch of consecutive red bars can be the beginning of that turn.
Why I Avoid Mid-Range Reversals
Mid-range reversals rarely move strongly enough to offset spreads, slippage, or risk. Trying to time reversals here isn’t going to give you enough volatility to make a profit.
Layering Bollinger Bands With RSI
I don’t use Bollinger Bands much in my trading, but here is why they pair well with RSI for general knowledge. Price stays inside the bands almost all the time. When a candle closes outside the upper or lower band, it signals an unusual extension. If that extension happens while RSI is at an extreme, many consider the reversal setup much stronger.
When I Don’t Use RSI
RSI is effective, but only when used consistently and intentionally. I don’t use RSI in my trades often. When I’m trading pure momentum, I rely more heavily on MACD, moving averages, volume, and the structure of the chart.
Too many indicators create confusion. If you’re going to use RSI, use it on every trade so your intuition develops. Otherwise, the inconsistency will work against you.
Conclusion
RSI is simple, but it becomes powerful when you understand what its extremes actually represent. Some use it to avoid false breakouts, spot divergence, and confirm when a reversal is likely forming. Most of the value comes from using RSI at the edges of its range rather than in the middle.
Join me inside Warrior Trading to watch live trades and learn the strategies that keep me consistent. Ready to practice without the risk? Start with the Warrior Trading Simulator and build your skills today.
With practice, you’ll start seeing the same patterns: exhaustion, divergence, and confirmation. When you combine RSI with clear price action and other reliable indicators, it can become an important part of your day-trading toolkit.