

We all like to make fun of the unfulfilled predictions of meteorologists, but perhaps the trading community should hold back its ire since weather prognosticators and day traders employ some similar methods.
Like day traders, meteorologists are constantly looking for patterns and signals that imply a change is about to occur. Anyone can look outside and say tomorrow’s weather will probably be similar to today’s.
But predicting the weather is about figuring out when the change will occur – much like a trader analyzing a stock chart.
Another similarity is that these patterns and signals we look for aren’t always accurate.
A pennant pattern forming on a stock chart doesn’t mean the share price is going to continue upward with 100% certainty. Likewise, a system with high winds forming over warm water won’t always turn into a hurricane.
Meteorologists don’t necessarily make predictions – they offer ranges of outcomes.
And when traders use technical signals like the double bottom pattern, they’re doing the same thing.
What is the Double Bottom Pattern?
The double bottom pattern is a momentum trading signal that’s used to predict when a trend might be about to turn.
This pattern is recognized by the stock making two similar lows following a downslope.
While these two price points don’t need to be identical, the stock should bounce off from (at least) two similar areas before a double bottom pattern can be labeled.

A double bottom pattern forms after a large drawdown and signals that the selling pressure has begun to let up.
The stock may not make any meaningful moves upward, but the bottoming formation should act as a new support level.
Breaking Down the Double Bottom Pattern
When trying to spot a double bottom pattern, you want the preceding decline to be sharp – at least 10% but it could be as much as 30%.
A decline of only 2-3% might turn out to be noise and since no signal operates with absolute certainty, we want to eliminate only the most obvious pattern formations.
Remember, certain criteria must be present for us to trade off a double bottom pattern. Here are a few examples to drive the point home.
Example 1: PotBelly Corporation (PBPB)

PotBelly Corporation is a small sandwich shop operator with 400 locations and a market cap under $100M. Like most stocks in the hospitality sector, it tanked in March as the pandemic took hold and dipped below $2 per share before the end of the month.
A couple false rallies followed in the spring but the stock bottomed out around the same price point again in June, forming a clear double bottom pattern.
Traders needed to be patient as the upswing stalled out initially, but the stock stayed above the $2 mark before nearly doubling in July alone.
Example 2: Kemper Corporation (KMPR)
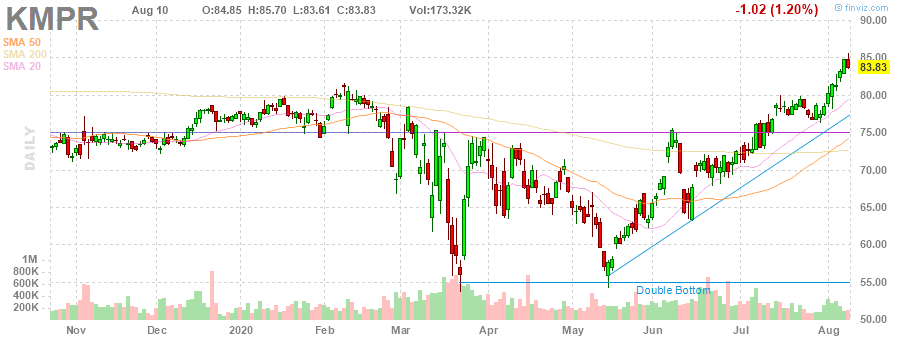
Here’s an example from a more established firm. Kemper Corporation is a large insurance provider offering property, casualty, and health insurance services.
With a market cap over $5B and nearly 10,000 employees, this isn’t a stock that can be pushed around by pump and dumpers.
After topping $80 per share in February, the stock took a dive down to the $55 range before bouncing back rapidly.
However, that rally was short-lived and the shares again fell back below $60 but again stopped right around that $55 mark in mid-May.
Astute traders who took notice of this double bottom here were quickly rewarded as the stock broke out to new 2020 highs in the first week of August.
Example 3: Bluegreen Vacations Corporation (BXG)

No industry was hit harder by the coronavirus than the travel sector and Bluegreen Vacations Corporation was one of the companies getting a 60% haircut in the meltdown.
Like many stocks during this time period, the initial bottom formed in mid-March and that support level was retested again in mid-May.
The stock hovered around the $3 mark during May before breaking back above $4 in June and never again retesting the support level formed by the double bottom.
BXG still has a long recovery to make, but sharp traders would have pocketed a 100% gain if they bought when this support level was once again confirmed.
Tips for Trading a Double Bottom Pattern
Like any technical trading signal, a double bottom pattern isn’t a guaranteed path to riches. Many false positives occur when looking for trading signals so don’t go hunting for them – let them come to you instead.
Here are a few tips for trading the double bottom pattern.
Patience is a virtue – As you can see from these examples above, the double bottom pattern is usually one for the swing traders, not the day traders. When a double bottom forms, it can take weeks or even months for the breakout to occur.
Don’t get antsy during these trades. If you believe in your trade, stick with it until the chart turns against you.
Keep position sizes the same – Sometimes traders can get into the mindset of gamblers and seek to recoup losses by doubling their next trade or pushing more capital into a failed trade.
Don’t let your emotions cause you to overtrade or change the size of your positions.
Take some time away from the screen – The double bottom pattern can be a slow reversal of a downtrend, which is great news for traders but doesn’t exactly require round-the-clock attention.
If you enter a trade that might not pay off for a few weeks, you don’t need to stare anxiously at your screens all day.
If you’re trading double bottom patterns, you’ll get plenty of opportunities to take a break – which is good for your mind anyway.
Bottom Line
Like any technical trading pattern, the double bottom takes practice to learn and you’ll still need a bit of that ‘feel’ in order to detect false signals.
Not every stock that makes two similar lows over a certain period of time is a double bottom.
Make sure all the criteria for the pattern formation are present (preceding sharp decline, two distinct lows at a similar price point) before making any trades.
And as always, stay patient – double bottoms are slow movers but offer great rewards to perseverant traders.