

With the outside world at a partial stand-still due to the ongoing COVID-19 pandemic, many of us across America are shifting our priorities to focus on our health, our relationships with our families and loved ones, as well as self-improvements and skill-building.
Some are also taking advantage of all the free time during the coronavirus lockdown to day trade stocks and make some extra money.
But if you are considering day trading stocks during the lockdown, it pays off to learn more about consolidation since it happens so frequently in the stock market.
In this article, I will walk you through what stock consolidation actually is, how to identify it on charts and finally how to trade it.
Hopefully, this will provide you with what you need to make the best decisions for your trading when the stock market inevitably changes from easily-tradeable conditions to less favorable conditions.
What is Stock Consolidation?
In financial markets, consolidation is a term that describes a stock or security that is neither reversing nor continuing a larger price trend. It can also be described as a phase when a stock trades within a range.
The trend is said to be sideways and tends to vary based on the circumstance. Bigger moves may follow once this range is broken, but the movement cannot be clearly predicted until the range is intact.
Consolidation often happens after sharp price movements as the market absorbs the information that triggered the movement in the first place. Traders generally interpret consolidation as market indecisiveness.
Consolidation periods are important as they help traders position themselves for the next move and are necessary for accumulation and distribution. Moreover, they are used by “big” market players to get into larger positions.
How to Identify Consolidation on a Chart
As we mentioned above, consolidation typically occurs right after an uptrend or a downtrend. The price move before and after consolidation tends to steer in the same direction. Identifying consolidation on a chart can be a great trading advantage and involves looking for stocks that:
- Trade in a narrow range
- Have low trading volumes
- Steady support and resistance levels
Trading Consolidation Strategies
If you’ve been trading stocks for any length of time, you’ve probably realized that the markets tend to move sideways a lot. Since consolidation is a big part of the market’s balance, it makes sense to know the strategies that take advantage of the consolidating/sideways type of market environments.
Breakout/Breakdowns
One of the most common strategies for consolidation trading is to check for breakouts and breakdowns. These are probably one of the most common and reliable technical chart patterns.
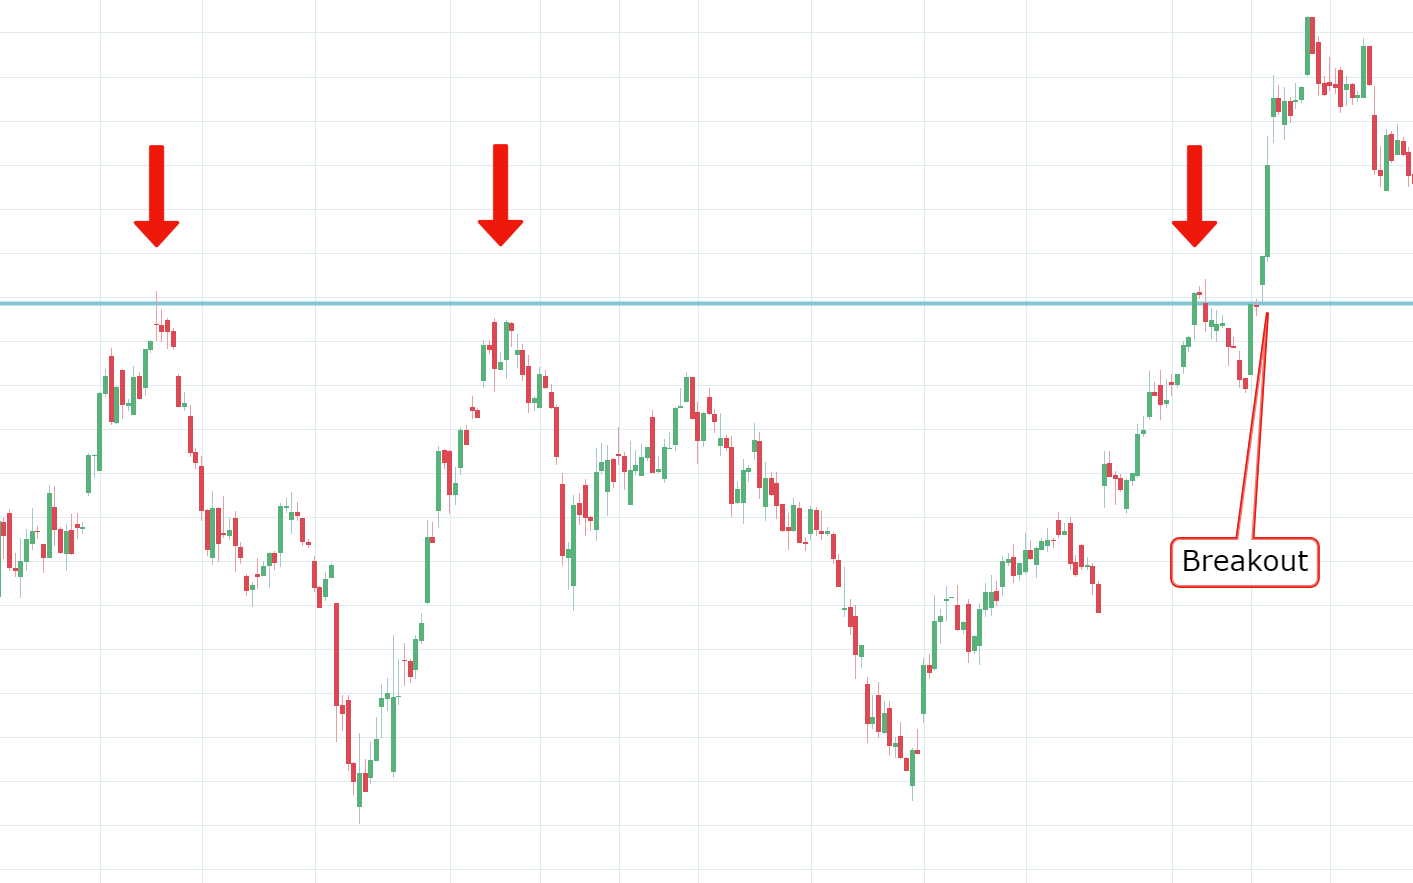
In technical analysis, a breakout is a bullish term that depicts a price move that exceeds a defined resistance level and proceeds to sustain higher prices until the next resistance level is formed.
Breakouts are usually accompanied with an increase in volume indicating motivated buying demand that exceeds existing supply as prices go up. Breakouts kick start uptrends in the underlying stock.
Traders buy a stock when its price breaks above a certain price level of resistance or sell the stock when it breaks below a level of support. A level of support is where the price of a stock tends to stop declining while a level of resistance is where the stock tends to stop going up.
Example
A breakdown, on the other hand, is a breakout to the downside. The stock trades sideways for a while but it’s not able to gain the strength to go up.
When this happens, it is usually a sign of an internal weakness in the stock and the consolidation is usually followed by a downward move. The price of the stock then breaks down and eventually trades beyond the low of the consolidation.
It is just like a weightlifter who keeps trying to keep the weights up but is not able to do so. When the pain is too much, the weightlifter sends the weight crashing down on the floor. Just as it is easier to drop the weight than keep it up, a stock declines 4 times easier than it increases.
Example
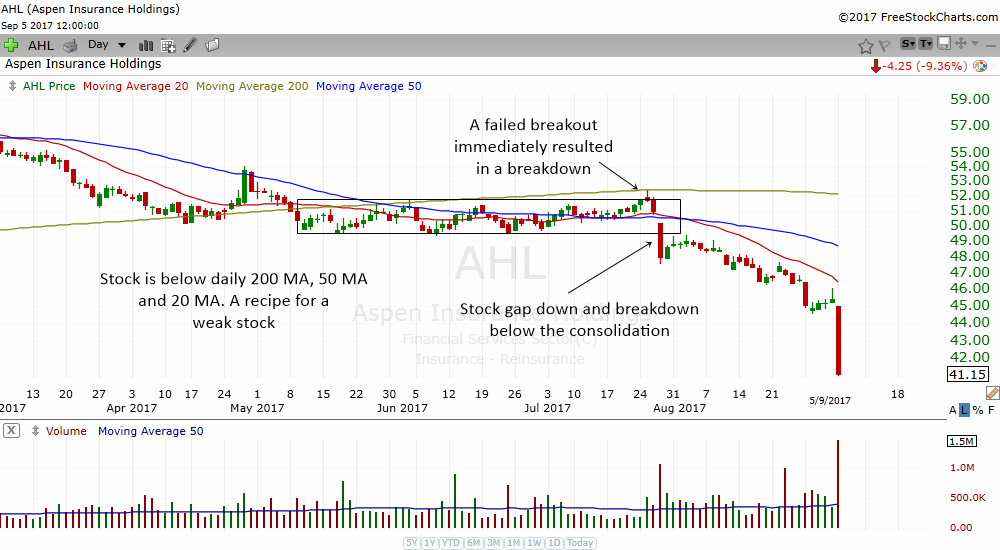
The stock breakdown is a chart pattern that you can find again and again in many stocks. It can be a valid trading strategy for day traders, but to have a great setup, the stock:
- Needs to have a relatively tight consolidation
- Should be below 200 moving average
- Range bound trading
Another alternative strategy for consolidation is to examine the range-bound behavior. In a range bound market, stocks trade between two specific points of support and resistance without showing any sign of breaking these points. Simply put, the stock price bounces in between a specific high price and a low price.
The high price acts as a major resistance level that the stock price can’t seem to break through, while the low price acts as a major support level that the price can’t seem to break. Traders usually look at the bottom of the range as an area that provides buying opportunities and the top of the range as a selling zone.
Example

Bottom Line
Consolidation can create high levels of volatility and also open the door to opportunity for day traders and other short-term traders.
Learning how to identify consolidation on a stock chart versus a true trend change can help traders to effectively manage their trading strategies.
Furthermore, breakout/breakdowns and range-bound trading are simple and straight-forward strategies that you can implement when trade these types of market conditions.