

- Pennant Chart Pattern: How To Identify
- What Is a Bull Pennant Pattern?
- Why the Bull Pennant Pattern Matters for Day Traders
- Anatomy of a Bull Pennant Pattern
- The Flagpole
- The Pennant Consolidation
- The Breakout
- Bull Pennant vs. Bull Flag: What’s the Difference?
- How To Identify a Bull Pennant Pattern in Real Time
- Look for Strong Prior Momentum
- Confirm the Consolidation Is Tight
- Pay Attention to Volume
- How Day Traders Trade the Bull Pennant Pattern
- Entry Strategies
- Stop-Loss Placement
- Profit Targets
- Common Mistakes When Trading Bull Pennants
- Pennant Patterns in Day Trading vs. Swing Trading
- Final Thoughts on the Bull Pennant Pattern
When I’m looking for momentum trades, I want clarity. A strong move, a brief pause, and a setup that gives me a clear plan. That’s where the bull pennant pattern comes in.
It’s a continuation pattern that often shows up during fast-moving stocks and gives day traders a structured way to trade potential breakouts.
What Is a Bull Pennant Pattern?
A bull pennant pattern is a continuation setup that forms after a strong upward price move. The stock makes a sharp push higher (the “flagpole”), then pauses and tightens up into a small triangle. That triangle is the pennant.
This pause matters. It shows buyers and sellers reaching a temporary balance after a fast move. The big question is whether buyers step back in and push prices higher again. When that happens, we get the breakout.
Pennants can form in both directions, but the bull version is the one day traders watch during strong uptrends and momentum moves.
Why the Bull Pennant Pattern Matters for Day Traders
Day traders focus on setups that offer defined risk and quick resolution. Bull pennants can provide both.
These patterns matter because they often:
- Appear after a proven move higher
- Form tight consolidations that limit downside risk
- Create clear breakout levels
- Resolve quickly once the breakout happens
Not every pennant works. The value comes from the structure and the context around it, not from the pattern name alone.
Anatomy of a Bull Pennant Pattern
The Flagpole
The flagpole is the initial surge higher. I’m looking for a move that stands out on the chart, not a slow grind. The best flagpoles are steep and decisive, often with increased volume.
This move matters because it attracts attention. Without strong interest during the flagpole, the odds of a meaningful continuation drop.
The Pennant Consolidation
After the flagpole, price pauses and compresses. This consolidation usually forms a small symmetrical triangle with lower highs and higher lows.
A quality pennant stays tight. The range should shrink, and price should respect the trendlines . Wide swings or deep pullbacks usually mean the setup is breaking down rather than building pressure.
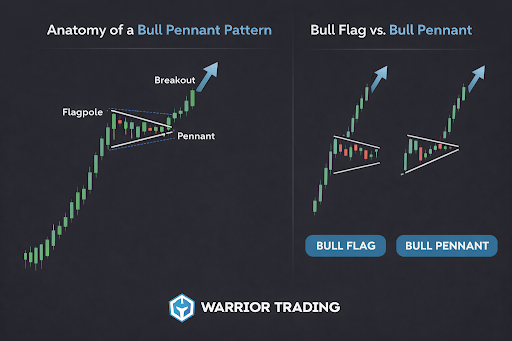
The Breakout
The breakout occurs when the price pushes above the pennant’s upper trendline. Ideally, this move is decisive and supported by renewed buying interest.
Not all breakouts run far. Some stall or fail. That’s why risk management matters more than prediction.
Bull Pennant vs. Bull Flag: What’s the Difference?
People mix these up because they both happen after a strong move, and they both suggest continuation. The difference is the shape of the pause.
- A bull flag looks more like a small downward-sloping channel or rectangle.
- A bull pennant looks like a tight triangle where highs come down and lows come up.
Both can work. I don’t treat one as better by default. I care more about the quality of the move leading into it and how tight the consolidation stays. If the pause is tight and organized, I’m interested. If it’s loose, wide, and sloppy, I’m not.
How To Identify a Bull Pennant Pattern in Real Time
Look for Strong Prior Momentum
The pattern starts with momentum. I want to see:
- A clear intraday trend higher
- Strong relative volume
- A stock that’s actively being traded
Pennants that form in low-volume, choppy charts usually don’t lead to clean breakouts.
Confirm the Consolidation Is Tight
A proper pennant stays compact. Price should compress without large pullbacks. I’m watching for:
- Smaller candle bodies
- Fewer extreme wicks
- Clear tightening into a triangle
If the price keeps dropping far from the highs, it’s no longer a pennant.
Pay Attention to Volume
Volume often tells the story:
- Expansion during the flagpole
- Contraction during consolidation
- Expansion again on the breakout
This doesn’t happen every time, but it’s a useful confirmation when it does.
How Day Traders Trade the Bull Pennant Pattern
This is where traders get into trouble, because they treat the pattern like a guarantee. It’s not. It’s a setup. Execution is the whole game.
Entry Strategies
There are two common ways traders approach entries:
- Breakout entry: Buy when price breaks above the pennant’s upper trendline.
- Confirmation entry: Buy after the breakout holds and proves it’s not a quick fakeout.
Breakout entries can give better prices, but they also get trapped more often. Confirmation entries can reduce false starts, but they can also mean you enter later. I care more about consistency than being first.
Stop-Loss Placement
Stops should make sense based on the structure. Common options include:
- Below the lowest low in the pennant
- Below the most recent higher low inside the pennant
- Below a clear support level that the setup depends on
The tighter the pattern, the cleaner the stop. If you can’t place a stop without giving it a huge amount of room, the setup is not tight enough.
Profit Targets
A simple target approach is the measured move, where traders use the flagpole length and project it from the breakout point. That can be useful as a reference, but I still pay attention to real-world resistance levels.
Targets often depend on:
- Nearby premarket highs
- Whole and half-dollar levels
- Prior day highs
- Obvious resistance on the intraday chart
In practice, many day traders scale out. Taking partial profits can reduce the emotional pressure when the stock pulls back after the initial breakout pop.
Common Mistakes When Trading Bull Pennants
Most pennant problems come from forcing the setup where it doesn’t exist.
- Trading pennants without real momentum
- Entering after the breakout is already extended
- Ignoring volume signals
- Treating loose consolidations as valid setups
- Oversizing positions and panicking on normal pullbacks
Pennants reward discipline and punish excitement.
Pennant Patterns in Day Trading vs. Swing Trading
The structure is similar, but the time horizon changes everything.
In day trading , pennants usually form and resolve quickly. Traders look for momentum continuation within the same session, sometimes within minutes.
In swing trading , pennants can form over days or weeks. The consolidation can be larger, and the breakout can take longer. The risk management and position sizing need to match the timeframe. Same concept, different pace.
Final Thoughts on the Bull Pennant Pattern
The bull pennant pattern is a simple continuation setup that can work well in strong momentum conditions. The real edge comes from recognizing quality structure, managing risk, and avoiding forced trades.
When the setup is clean, it offers clear entries, defined stops, and fast feedback. When it’s messy, it’s usually best to step aside. Discipline matters more than the pattern itself.