
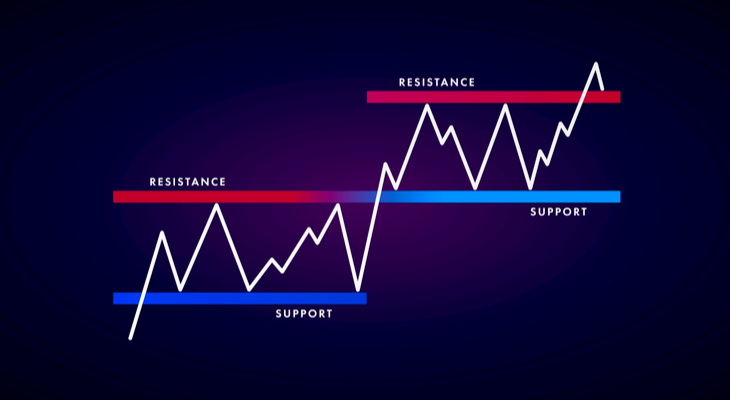
What is Support and Resistance?
Support and resistance is a stock market concept which gained steam in the 1800s and early 1900s. The idea is that certain price levels have significant imbalance of supply and demand, and serve as market turning points.
In plain English, a support level is a price level where buyers are more aggressive than sellers. This aggressiveness pushes the price up, away from the level of increased demand.
There’s a supply/demand imbalance, with more demand than supply, so the price must rise to meet the demand.
The same is true in reverse for resistance levels.
Traders identify support and resistance levels by analyzing which price levels are repeatedly defended by buyers, or rejected by sellers. Identifying said levels is easier said than done, of course, because there’s tons of randomness in financial markets.
Sometimes a stock will pause at a given price multiple times due to sheer randomness, rather than a true supply/demand imbalance.
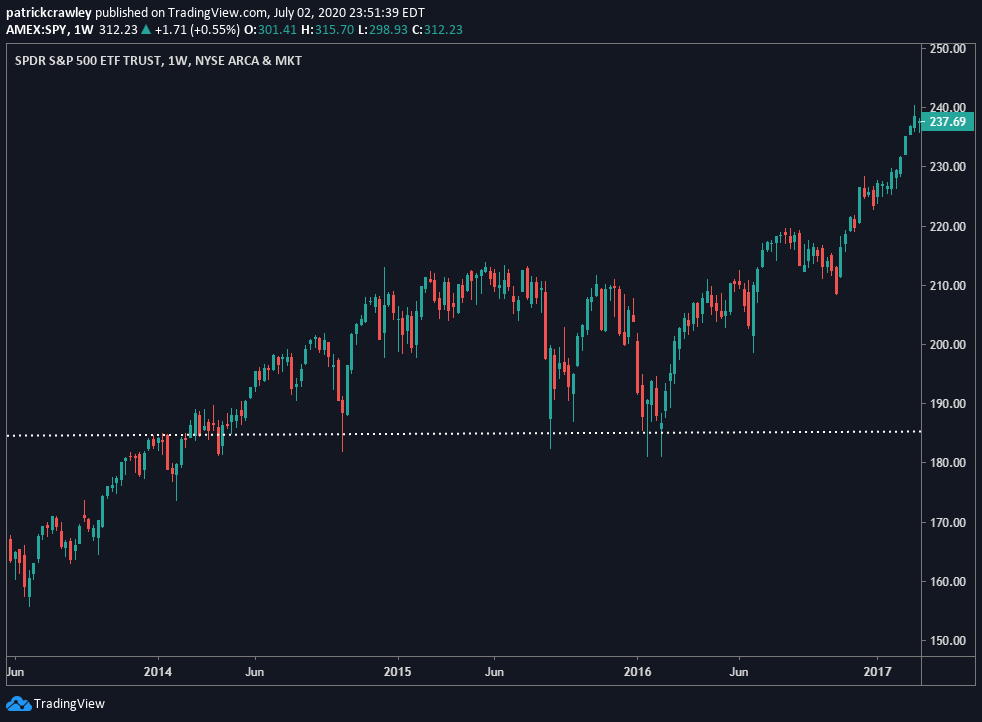
Many would consider the $180-$185 level in the SPY chart above to be support, as evidenced by the aggressive buying whenever price reached the level, quickly moving the price away from this level of outsized demand.
Support and Resistance: A Warning
While support and resistance is among the most straightforward concepts for traders to learn, profitable implementation is more complicated. The complication is because there’s so much nuance to differentiating between random price levels and true support and resistance levels.
Often what looks like a support and resistance level is simply the randomness of the chaotic financial markets.
In the following video, Grimes hides the price data of his charts and types in a random ticker. He then draws several completely random support/resistance levels and displays the price data.
When combing through the intraday action, he actually finds quite significant action around his random levels, suggesting our mental fallibility to look for patterns in what is sometimes randomness.
Identifying Support and Resistance
If you’ve watched the video I linked above, you know that distinguishing between random price levels and true support and resistance levels is difficult. But, it’s obvious that there’s identifiable price levels that are significant and serve as a market turning point. So how do we find those?
It comes down to the price action around the support/resistance level. True levels leave their clues.
Look at Highs and Lows
There’s a reason trend-following traders breakouts of periodic highs and lows to enter their positions. The theory behind their trades is that if an asset breaks through the most recent high, the chance of a significant shift in supply/demand is high.
Previous swing highs and lows are also often used by traders to set their stop loss and take profit levels. As a result, you’ll observe the increased activity around these levels, which should serve as a hint to look for further evidence of a true supply/demand imbalance.
How Many Tests?
The first principle is that the more times a stock retests a support or resistance level, the more likely it is to fail. This can feel paradoxical when the conventional wisdom states the opposite.
You’re often told that the more times a stock tests a level, the more that level is confirmed. But, the strongest stocks seldom trade back down to their support levels.
How The Stock Reacts Around Support and Resistance
Wyckoff Upthrusts and Springs are breadcrumbs left by smart money, which can clue you into accumulation or distribution in effect.
Essentially, a Wyckoff Spring occurs when a stock dips below a support level and recovers quickly and aggressively. It’s telling you that buyers found the price so favorable that they bought at the market, without regard for building their position.
The Wyckoff Upthrust is the same thing, but in reverse, when stocks reject a spike above resistance levels.
These are massive clues.
The market is telling you that buyers are delighted to buy at that level, that buyers will aggressively push the price up, should it trade there again. This serves as confirmation that a support or resistance level is actually a level worth paying attention to.
Support and Resistance in Trends: A Note
Support and resistance levels are dynamic, especially in trends. Throughout an uptrend, levels of support tend to look like a trendline, usually clustering around higher lows. As the price rises, the price where buyers consider the stock to be “too cheap” also changes, which creates new support levels on the way up.
The same is also true for resistance levels. In an uptrend, a stock is continuously breaking through perceived resistance levels and making new highs.
The pullback in an uptrend trade is one of the most classic and well-established trading patterns out there. I’ve seen traders who trade the trend pullback using support and resistance levels.
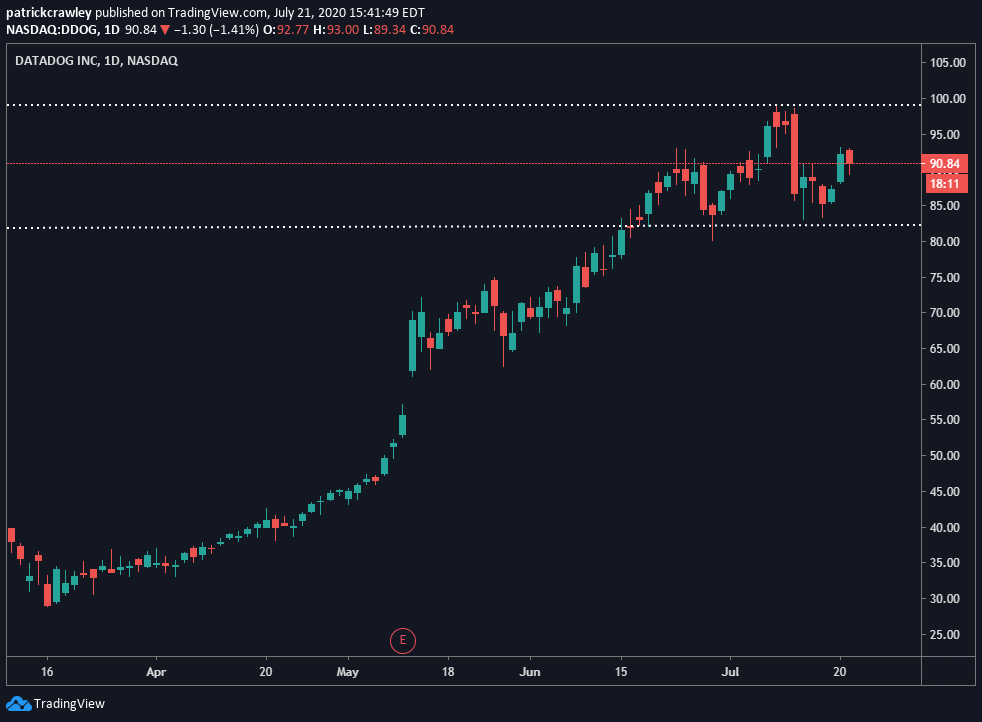
The above is an example. The first step is to identify a support level within an uptrend and wait for the stock to pullback. As you can see in Datadog (DDOG) above, the stock recently caught a bid around $84 after plummeting for two straight days.
A simplified explanation of what many traders would do in this situation is to set a buy order at the support level, set a stop loss, then set a take profit level at the previously established resistance level (also a periodic high) at around $99.
It’s also popular for traders to sell 50% of their positions at the resistance level, and hold the rest in anticipation of a breakout above resistance.
Suppose DDOG continues to rally and clears the $99 resistance level. In theory, that resistance should now become support. Smart traders would watch how the stock reacts when it pulls back to the $99 level, as it might present another trend pullback opportunity.
Bottom Line
In closing, here are the main points you should take away:
- Support and resistance are levels of supply/demand imbalance.
- As a general principle, previous resistance becomes support and vice versa.
- True support and resistance levels are challenging to identify. Most levels that look like support and resistance are randomness.
- Support and resistance levels are dynamic in trends.