

The Morning Star might have unpleasant Biblical connotations, but it’s an important bullish pattern for day traders to look for. The Morning Star is a signal that a downtrend could be nearing its end and a reversal to the upside could be on the horizon.
On the other hand, the Evening Star is the Anti-bull, a pattern that signals that an uptrend could be on the verge of petering out.
Traders need to be aware of many different trading patterns, but the Evening Star is a crucial one to pay attention to. Since the Evening Star signals that a bull run in a stock could be ending, its appearance is a red flag to many investors and a sign that it might be time to take profits.
Today, we’ll look at some examples of the Evening Star pattern and explain how to trade it properly.
What is the Evening Star Pattern?
The Evening Star pattern is a set of three candlesticks that many traders consider to be a “topping” signal, meaning that it’s time to cash out before the stock turns down. Candlestick charts are terrific trading tools because they provide so much more information than a simple line chart.
Each candlestick tells you four pieces of information: the opening price, closing price, high of the session, and low of the session.
Green or white candles show an overall rise in price while black or red candles show an overall decline. If the stock closes lower than it opened, the candle will be red or black. If it closes higher than it opened, the candle will be green or white.
The larger the candle, the greater the trading range in that given day or time period was.
The Evening Star isn’t a common pattern, so it’s appearance should be taken with appropriate concern. However, remember that the appearance of a single pattern or indicator isn’t a slam dunk buy or sell signal.
Always confirm that technical patterns are consistent with current trends before using them as trading signals.
How the Evening Star Pattern Works
The Evening Star pattern has a time frame of three candle periods, each measured with its own candle. So on a daily chart it would require 3 days of price action.
When the Evening Star pattern takes shape, traders often heed their charts and sell the stock (or short it if they agree with the bearish sentiment).
The Evening Star pattern materializes when prices begin to constrict at the end of a bull run. The pattern is marked by a large green candle that signals a continuation of the current trend, followed by a much smaller red or green candle that sits above the initial candle.
This tiny candle forms the aforementioned ‘Evening Star’, which sits above the rest of the chart like a star in the sky.
The third candle is another larger one, but this time it’s a red candle with a trading range larger than the middle candle but smaller than the first green candle.
The Evening Star doesn’t appear out of nowhere. To be considered a signal, this pattern must appear during an uptrend in price action.
In fact, the first candle should show significant buying strength – otherwise the pattern may be a false alarm.
The second candle should have a tight range and a close above the first candle, while the third candle should have a lower open than the second but finish somewhere between the opening and closing price of the first candle.
Confused?
Let’s take a look at some examples.
How to Trade the Evening Star Pattern
Trading the Evening Star pattern takes practice and intuition. Just because three candles look like the Evening Star pattern doesn’t mean a signal has materialized.
Don’t go looking for Evening Star patterns, but understand the conditions and circumstances where it might appear.
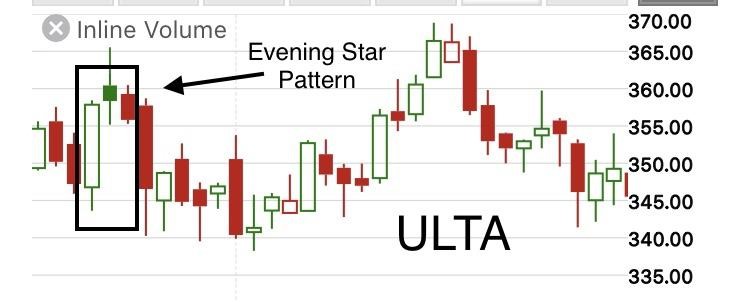
Example 1: Ulta Beauty (ULTA)
Ulta Beauty Inc has been one of the best performing stocks of the last decade, despite recent price declines.
However, the stock did provide a quality look at the Evening Star pattern back in June of 2019. As you can see from the chart, a large bullish candle with a wide range marked the beginning of the pattern.
This was followed by a smaller bullish candle with a tight range that opened higher than the previous candle. Finally, the pattern is confirmed by the third candle, which shows an opening price near the close of the previous candle but a close inside the body of the first candle.
Following this pattern’s appearance, ULTA’s stock price declined from $360 to $340 in just a few days before rebounding.
Example 2: Oracle Inc. (ORCL)

Oracle Inc has an Evening Star pattern potentially forming right now.
The stock has been in an uptrend since bottoming during the height of the coronavirus shutdowns. After several wild trading days, the uptrend began to wane and the large bullish candle that starts the Evening Star pattern formed.
This was followed by a tiny bullish candle with an open and closing price higher than the previous day.
Finally, the large bearish candle made an appearance, complete with an opening price below the previous day’s close and a closing price within the range of the first candle.
While not 100% accurate, the Evening Star’s appearance here should be a warning sign to Oracle investors that the stock could be maxing out on its current upswing.
Bottom Line
Like all technical trading signals, the Evening Star pattern should be used in conjunction with other technical tools like trendlines and volume oscillators.
One thing to keep in mind is just because a pattern is rare and powerful doesn’t mean it’s 100% accurate.
The Evening Star pattern is just another tool in the trader’s toolbox. If you notice it appearing during an upswing, take note and see if the stock confirms the pattern and reverses its trend.
If you can spot the pattern before the downtrend begins, you could be looking at a very profitable trade.