

The bump and run reversal pattern is an advanced chart pattern that helps traders spot the end of a trend and the start of a new one.
Below we will go over what the pattern looks like and tips on how you can trade it.
What is the bump and run reversal pattern?
The bump and run reversal chart pattern, also known as BARR, is a reversal pattern that is formed when a stock goes through a fast and large price hike as a result of excessive speculation in the market regarding the stock.
This pattern was introduced by Thomas Bulkowski in 1996 while researching price prediction techniques using trendlines. Bulkowski later included the pattern in his book, the Encyclopedia of Chart Patterns.
The pattern was also introduced in the June-97 issue of Technical Analysis of Stocks and Commodities.
Phases of the bump and run reversal pattern
Originally known as the bump and run formation, the bump and run reversal pattern is split into three key phases as shown below.

Phase 1: Lead-in Trendline
The first section of the bump and run reversal is known as the “lead-in” trendline and often forms the handle part of the frying pan shape. This part starts at the beginning of the pattern and it precedes the bump phase.
It has the shape of a relatively shallow trough that falls away from, then back to a downward trend line.
The lead-in represents an uptrend during which the stock price rises normally as would happen with any other stock without any signs of too much speculation. The trend line is steep during this phase.
Phase 2: The Bump
The second phase is known as the bump phase. It is a much larger trough with edges that touch the same downward trend line mentioned above.
During this phase, the price of the stock rises rapidly when compared to the first phase. The trend line of the bump phase tends to become steeper when compared to that of the first phase by nearly 50%.
Phase 3: The Run
The run phase begins when the stock price reaches back to the trend line. Sometimes, the price may break the trend line and then pull back, therefore making it the new resistance level.
Why it forms and what it means
As earlier mentioned, bump and run reversal chart pattern forms when excessive speculation drives prices up too far, too fast. When the pattern forms, it indicates the reversal of an existing trend, whether it be short or long term.
When trading using this pattern, you can validate if there is actually a bump pattern forming by comparing the maximum height of the bump phase with that of the first phase.
After the stock price has reached its peak, it begins moving down towards the trend line, and the chart begins to show the right side of the bump.
How to trade the bump and run reversal pattern
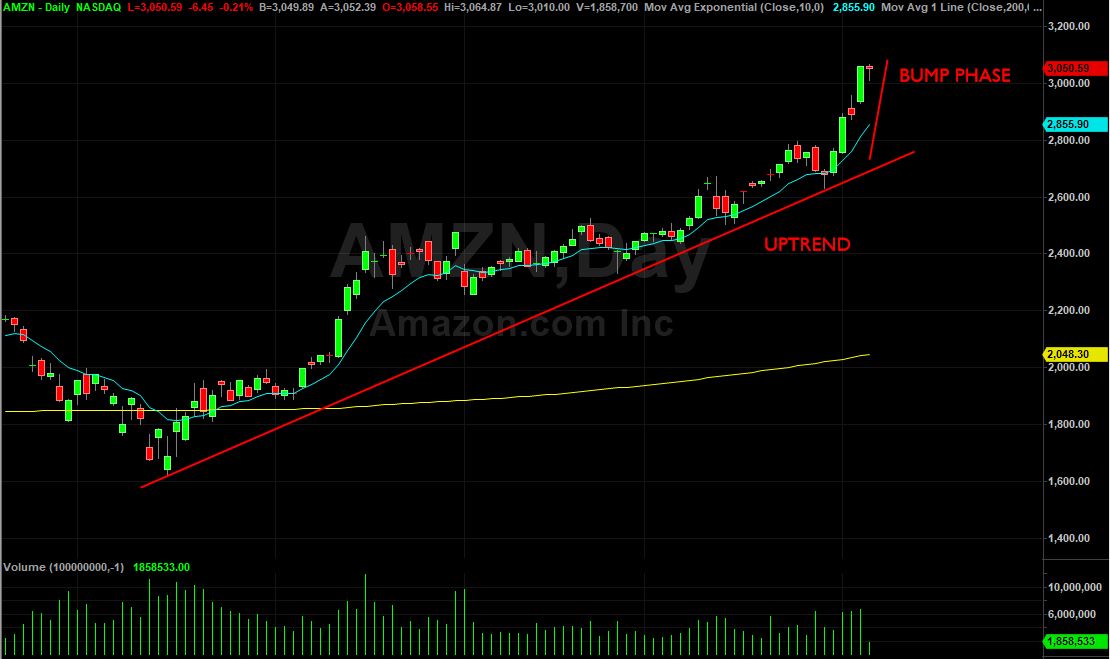
When trading using this pattern, the first thing you need to do is identify an uptrend and then an acceleration of that uptrend (Example of accelerated uptrend in $AMZN chart below). These two components of a trend form the first part of the pattern.
Checklist for trading the bump and run reversal pattern:
- Identify a trending stock. The pattern ought to be inclined anywhere between 30 and 45 degrees on the chart.
- The bump on the chart should definitely be steeper, with an inclination anywhere between 45 and 60 degrees on the chart. Bulkowski suggests adding the height of the formation at the lead-in section to the breakout price to arrive at a minimum upside price objective.
- Volume is essential for the validity of the bump and run pattern. Volume is usually low during the preceding trend. Then it spikes higher once the bump appears on the chart. This helps lift the stock higher, forming the actual bump on the chart.
- Confirm the validity of the bump and run pattern, by checking whether the vertical distance between the top of the bump and the leading trend is at least twice the size of the vertical distance between the top of the price action prior to the bump and the leading trend line.
- The actual confirmation of the bump and run reversal pattern comes with the breakout through the leading trend line. Once the bump is created, the price is expected to initiate a move toward the trend line.
Although the stock price action may hesitate for a while when the trend is reached, a breakout will appear through the trend if the pattern is valid. If you see the breakout, then the pattern is valid and you can go ahead to pursue its potential.
You should only open a trade after you’ve confirmed the validity of the pattern and spotted a breakout through the leading trend.
If the pattern is bearish, you should trade the bearish breakout with a short position. If it’s bullish, trade the bullish breakout with a long position.
Bottom Line
The bump and run chart pattern is a remarkable reversal pattern that can help you spot the end of a trend and the beginning of a new one.
This is a powerful pattern that takes advantage of the result of excessive speculation, thus propelling the price too fast to the extreme that leads to a reversal.
Traders tend to use it when they want to capitalize on very fast-moving markets. It can also be used to identify situations where a stock is being pumped and then getting dumped.