

What is Chaikin Oscillator?
The Chaikin Oscillator (CO), also called the Chaikin Indicator, is used by traders analyze the strength of a price trend based on trading volume.
This oscillator is represented by charts: a divergence between this indicator and the price trend shows that most traders have less faith in the current price trend and believe that a trend reversal is in the making.
Developed by in the 1970s by a well-known American trader Marc Chaikin, the oscillator attempts to confirm price trends and to warn of impending price reversals. Chaikin is also credited for creating the Chaikin Money Flow indicator, which is also widely used across Wall Street.
The CO is based on another indicator, the Accumulation Distribution Line (ADL) indicator, and is calculated by subtracting a 10-period exponential moving average from a 3-period exponential moving average of the ADL indicator.
Simply put, the CO is the difference between a ten-period moving average of asset price less a three-period moving average of the newly-generated ADL’s value.
How the Chaikin Oscillator works
The Chaikin Oscillator is basically the Moving Average Convergence Divergence (MACD) applied to the Accumulation Distribution Line indicator.
This makes it an indicator of an indicator since it attempts to predict changes in the ADL indicator.
The ADL is derived from an index known as the close location value (CLV), which compares the high, low and closing prices of a security.
If the closing price is below the midpoint of the high-low range, the CLV will be negative; if the closing price is above the midpoint, the CLV will be positive.
A cumulative total of the CLV multiplied by the volume of the asset generates the ADL, which is low when closing prices and volume are low, and high when closing prices and volume are high, indicating pressure in either direction on the security.
Back to the Chaikin Oscillator…
Many of the same signals that apply to the MACD are also applicable to the Chaikin Oscillator However, it must be remembered that the Chaikin signals refer to the Accumulation Distribution Line and not the stock itself.
The CO is great for adding momentum to the ADL indicator, though it can sometimes add too much thus making it difficult to interpret.
If the Chaikin seems very sensitive to price moves from the ADL indicator, then you may need to alter the moving averages.
Calculating the Chaikin Oscillator
In order to calculate the Chaikin Oscillator, traders need to follow the following steps.
First, calculate the Money Flow Multiplier. Second, multiply this value by volume to find Money Flow Volume. Third, create a running total of Money Flow Volume to form the ADL.
Finally, take the difference between two moving averages to calculate the Chaikin Oscillator.
Find the money flow multiplier
Money Flow Multiplier = [(Close – Low) – (High – Close)] /(High – Low)
Calculate money flow
Money Flow Volume = Money Flow Multiplier x Volume for the period.
Determine ADL
ADL = Previous ADL + Current Period’s Money Flow Volume
- Chaikin Oscillator = (3-period EMA of ADL) – (10-period EMA of ADL)
How to use the Chaikin Oscillator in trading
Traders and chartists rely on the Chaikin Oscillator to anticipate directional changes like other momentum indicators.
It does this by measuring the momentum behind the movements in the Accumulation Distribution Line.
Since a momentum change is the first step to a trend change, forecasting trend changes in the ADL indicator can help traders predict trend changes in the underlying security.
The Chaikin Oscillator generates signals with bullish/bearish divergences or with crosses above/below the zero line.
There are two bullish signals generated from the Chaikin Oscillator: bullish centerline crossover and positive divergence.
Since the Chaikin Oscillator is an indicator of an indicator, a bullish centerline crossover should confirm a positive divergence.
In direct contrast to the bullish signals, the Chaikin Oscillator can also produce two bearish signals: bearish centerline crossover and negative divergence. A bearish centerline crossover should confirm a negative divergence.
Example 1
As previously stated, the OC is calculated by subtracting a 10-period exponential moving average from a 3-period exponential moving average of the ADL.
This yields a series of numbers that can be plotted on a graph as shown in the example below.

The CO chart is important when it shows divergences with the price chart. You can clearly see that the uptrend of AEM stock, which is indicated by line a, is accompanied by the horizontal line b in the CO chart.
This divergence is a warning and it indicates that the price is rallying on low volume and that the uptrend is thus coming to an end.
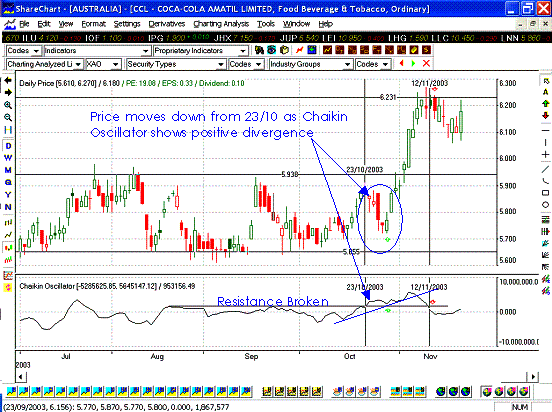
Example 2
The following example uses a 13-period Chaikin Oscillator. Shares of Coca Cola Amatil Ltd showed a Chaikin Oscillator divergence as price was going down.
The reversal formed from an engulfing day candlestick, sparking a short-lived upward trend from $5.8 to $6.2 approximately.
Advantages of using the Chaikin Oscillator
- Indicator faster
- Successfully combined with other oscillators
- Does not redraw its values
Disadvantages of using the Chaikin Oscillator
- You need to use it with other indicators to filter the false alarms that occur quite often
- Excessive flexibility of the indicator can be confusing to both beginner and experienced traders
How the Chaikin Oscillator differs from other indicators
The CO is different from other volume oscillators in that it substitutes the average price of the day for the opening price.
If a stock closes below the day’s midpoint ( i.e. (high + low) / 2), then there was less accumulation than distribution. The further a stock closes to the high, the less accumulation there was, and vice versa.
Bottom Line
Traders have always sought to use volume to confirm price behavior. The Chaikin Oscillator, either alone or accompanied by the other indicators, can help traders identify significant moments in this relationship.
As earlier mentioned, when the CO is at a high value, the ADL is at a low value relative to the asset price, indicating that selling pressure is increasing on the asset and that a price reversal is imminent.
Conversely, when the CO is at a low value, buying pressure is increasing and an increase in price is equally imminent.
Therefore, traders can use the oscillator to determine the best time to sell or buy a stock to avoid being caught up in (or in order to take advantage of) the imminent reversal.
If you are a day trader, and believe that the future can be predicted, then the Chaikin Oscillator may be of some use to you.