
Table of Contents
- What Is Gap Trading?
- Why Do Gaps Happen?
- The Gap Fill Strategy
- What Are Windows in Trading?
- How To Combine Gap Trading and Pullbacks
- Real-Life Trading Gap Examples
- Example 1: Gap Fill in Action
- Example 2: Trading a Window
- What Are Common Common Gap Trading Mistakes?
- What Are Other Tips to Succeed in Gap Trading?
- Wrapping Up
Watch the full video here:
When I first started stock trading, learning about gap trading strategies was a real breakthrough. Gaps are distinct patterns that offer incredible opportunities. These levels are critical and work well because so many traders respect this language of technical analysis.
Gap trading is a stock market strategy often utilized by both beginners and experienced traders to capitalize on opportunities in volatile financial markets. From a gap up or a gap down, these chart patterns can help you identify setups that align with your strategy.
Here, I’m going to break down what stock gaps and windows are, how they form, and how you can trade gap fills effectively. Let’s get started!
What Is Gap Trading?
Gap trading is exactly what it sounds like: stock trading based on price gaps in a price chart. Sudden price movements between a session’s closing price and the next session’s opening price create gaps.
There are different types of gaps, such as full gaps and partial gaps, which are influenced by the direction of the gap and the price range. You can have stocks that gap up, and you can have stocks that gap down. It’s simply opening higher or lower than the previous day.
Why Do Gaps Happen?
Gaps form due to major market events, such as:
- Breaking News: A company announcement, like a major acquisition, may cause a stock to gap up or gap down.
- Earning Reports: Positive or negative surprises in quarterly results can lead to gaps, influencing trading volume and volatility.
- Supply and Demand: Imbalances on buy or sell orders can create gaps.
Certain gaps, like runaway gaps, often occur due to low liquidity in pre-market trading before the market opens.

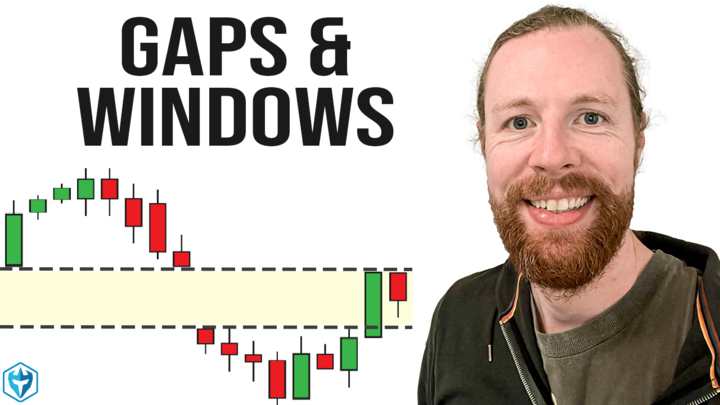
Gaps on a chart vs Windows on a chart
The Gap Fill Strategy
One of the best ways to trade price gaps is by using the gap-fill strategy. This approach takes advantage of the fact that gaps often get “filled,” meaning that the stock climbs back to fill the gap in the price range over time.
Let me walk you through it:
- Imagine a stock closes at $50 but gaps down to $40 after poor earnings.
- Over the next few days, the stock starts climbing back toward $50.
- As the price begins moving back upward, it doesn’t face any resistance until it hits the top of that gap or its 200-day moving average creating an opportunity.
Gaps filling can indicate the end of a trend, offering opportunities for traders to take a short position or prepare for a breakout.
What Are Windows in Trading?
Windows are another important concept in gap trading. While gaps occur between sessions, windows form within a single session. These are very long candlesticks and once you’re into this area, you have no resistance and no support.

The windows on these charts are in the form of large candles.
Check out this example:
- A stock drops from $50 to $25 within minutes, leaving a large red candlestick.
- The range of that candlestick — $50 to $25 — is the window.
- If the stock later starts climbing back, it can move quickly through the window until it hits resistance levels or a trend reversal.
How To Combine Gap Trading and Pullbacks
If you’re serious about gap trading, you’ll want to combine it with pullback strategies. This is one of my favorite setups because it allows you to enter with minimal risk while maximizing your reward.
Monitoring indicators like the RSI during the trading day can give you insights into potential proven actions around gaps.
Here’s how it works:
- Spot a stock with a gap up, gap down, or window.
- Wait for the first pullback, such as a micro pullback on a 5-minute chart.
- Enter during the pullback, ideally near a moving average, and ride the next leg up.
I’ve seen this work countless times. If we have this big window, a stock will squeeze up and then pull back just for a moment before ripping higher.
Real-Life Trading Gap Examples
Let me show you two different real-life scenarios to help you understand how gap trading works:
Example 1: Gap Fill in Action
A stock closes at $60 but gaps down to $50 after bad news, creating a clear trading range for experienced traders. Over the next week, it begins climbing back into the gap as traders capitalize on the absence of resistance between $50 and $60. This setup creates a prime gap-fill opportunity for those closely watching the price action.
As the stock climbs back into the gap, it moves freely until resistance leek appears.
Example 2: Trading a Window
A stock drops sharply from $60 to $30, leaving a long red candlestick. Later, when it starts climbing back, it moves quickly through the window until it hits resistance at $45.
Windows can be goldmines for traders, but you’ll want to zoom into shorter time frames (like a 5-minute chart) to spot hidden price levels and resistance levels.
What Are Common Common Gap Trading Mistakes?
Gap trading isn’t foolproof. Here are a few pitfalls to watch out for:
- Ignoring Volume: High relative volume is critical for gaps and windows to lead to significant price movements. Without it, gaps are less likely to be filled, and price action may stall.
- Overtrading: Not every gap is worth pursuing. Stick to high-quality setups.
- Forgetting Catalysts: Always look for the reason behind the gap. It’s usually tied to breaking news, earnings reports, or a shift in market sentiment.
As with all trading strategies, remember the disclaimer that trading risk involves.
What Are Other Tips to Succeed in Gap Trading?
If you want to master gap trading, here are a few extra tips to keep in mind:
- Use Scanners: High-of-day momentum scanners can help you identify stocks entering gaps or windows in real-time.
- Check Moving Averages: These often act as resistance or support, even within a gap or window.
- Stay Disciplined: Focus on setups that align with your strategy, such as gap trading strategies or continuation gaps, and avoid trading on impulse.
Wrapping Up
Gap trading is one of the simplest yet most effective strategies in day trading. By focusing on high-volume stocks with clear catalysts, like breakaway gaps or trend reversals, you can turn trading opportunities into profitable outcomes.
As I always tell my students, every trade is a learning opportunity. The key is to stay patient, practice your strategies, and keep improving. If you’re ready to dive deeper, download my Micro Pullback Strategy PDF or check out more lessons in my technical analysis series.