

The Chaikin Money Flow is a technical analysis indicator that is used to measure the buying and selling pressure in a stock over a period of time.
Intro
In the world of trading, huge market movements are usually triggered by the actions of giant hedge funds, mutual funds, pension funds, brokers, and other whales that trade the vast majority of volume, as opposed to small investors and traders.
If you can identify where these whales are going to put their money next, then you can make massive returns. This is why technical analysis indicators/oscillators are so important for day traders and other small retail traders.
An indicator can reveal the momentum behind a trend, whether the trend will be going up or down, and whether it is likely to reverse, among other things.
If you ever wanted to determine the strength of a trend based on the degree of buying and selling pressure, as well as its volume levels, the Chaikin Money Flow (CMF) is a helpful indicator that you can count on to do the job.
In this blog post, we will introduce you to the CMF indicator and a few trading strategies you can use test drive using it.
What is the Chaikin Money Flow?
Developed in the 1980s by famed stock analyst Marc Chaikin, this oscillator is based on the idea that when the closing price of a financial instrument is nearer to the low, a distribution occurs, whereas if the closing price is near the high, an accumulation occurs.
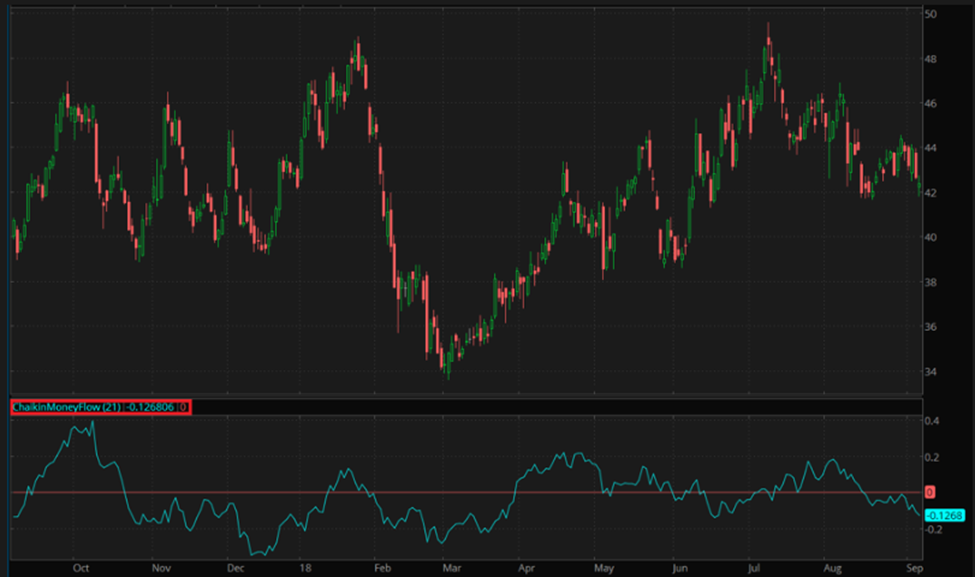
CMF is displayed as a red/green oscillator around a 0-line, which ranges from -100 to +100, with red regions representing selling pressure, and green regions representing buying pressure.
The negative and positive values are interpreted like this: When the line is negative, this usually indicates selling pressure. When it is positive, this usually indicates more buying pressure.
CMF calculation and formula
The Chaikin Money Flow is calculated using a very simple formula (for this example we will use a 21-period CMF).
First, you calculate the Money Flow Multiplier. This is done using the formula shown below.
Money Flow Multiplier = [(Close – Low) – (High – Close)] /(High – Low)
You then calculate the Money Flow Volume.
Money Flow Volume = Money Flow Multiplier x Volume for the Period
Finally, calculate the CMF. This is done by dividing the sum of Money Flow Volume by the sum of Volume.
21 Period CMF = 21 Period Sum of Money Flow Volume / 21 Period Sum of Volume
As with all the other technical indicators, you don’t have to do these calculations by yourself because the CMF indicator is found on most charting platforms and trading software. Your only task is to simply learn how to apply and interpret them.
How to trade using CMF
The Chaikin Money Flow is a momentum indicator and it’s, therefore, most useful when applied to trending markets where it helps traders determine the direction and strength of a trend.
This indicator moves below and above zero based on whether, on average, the stock is closing in the lower portion of the daily range or the upper portion, respectively.
Each day is multiplied by volume. Therefore, a down day accompanied by a small volume will result in a higher indicator reading than a down day on huge volume.
CMF indicator is often used on daily charts, but traders can also use it on intraday charts where volume data exists. It typically uses 21 periods since they represent roughly 1 month worth of trading days. However, multiples of this number, such as 42, 63, 84, 126, or 252 can also be used.
For day trading and other short-term strategies, a fewer number of periods are ideal because the CMF indicator reacts quicker to changes in trend. On the other hand, longer-term traders prefer a longer period indicator.
When you want to use the CMF, your first step should be to identify a chart that is not in consolidation. Consolidation usually happens when the price of a stock struggles to find direction and begins to move in a sideways direction.
Second, go to the settings of the indicator and choose your preferred period. In most cases, you can use the 12 default of the indicator. Finally, apply the indicator in the chart.
When you do this, you should look at the past movement of the CMF indicator. It is usually recommended to buy the stock when the indicator is moving upwards.
Similarly, you should sell the stock short when the indicator is below zero or moving downwards.
Let’s take a look at other ways you can use this indicator when trading stocks.
Breakouts
Another way to use the CMF is when you want to confirm breakouts.
Isolate a resistance or support area where the price has had trouble getting above or below it on several attempts. Mark these areas as resistance or support.
If the price rises through resistance, check the CMF to be above zero to confirm the breakout. If the CMF is not below zero, the breakout is likely to fail.
If the price drops through support, check the CMF to confirm the breakout. CMF should be below zero. If the price breaks support but the indicator is not below zero, it warns the breakout could likely fail.
Trend reversal
When the CMF indicator crosses the zero line, this suggests that the current trend is about to come to an end and a reversal is in the horizon.
If the indicator crosses from above the zero line, it is a bearish cross indicating the price will go down.
If the indicator crosses from below the zero line, this is a bullish cross indicating price will trend upward.
However, it is important to remember that a brief cross can be a false signal. You should use your own judgment by looking at the historical performance of the stock and adjusting your threshold accordingly.
Trend confirmation
CMF can also be used as a trend confirmation tool. When a stock is trending upward, the major buying power displayed by the indicator can boost your confidence level that the existing trend will continue in the near future. The opposite is true when a stock is trending downward.
Advantages of using the CMF
- The CMF indicator helps traders confirm the direction and strength of a trend.
- Easy visibility of divergence between the indicator and price, thus allowing traders to time entries and exits better.
Limitations of the CMF
- It is a lagging indicator that trails the price
- Plenty of false signals during a volatile market, when trends are not certain
Bottom Line
In this blog post, we have looked at what the Chaikin Money Flow is, how to set it up, and some of the strategies you can use to trade it.
This indicator can be useful for spotting momentum-related trends like when hedge funds or other big Wall Street traders are moving in the market.
But like all technical indicators, the CMF does not always give accurate signals, meaning that you should always use it with caution and combine it with other tools, such as trend lines and moving averages.