

As a day trader, you know one of the keys to understanding price movement is analyzing volume trends which is where the Ease of Movement Indicator comes in.
Volume and volatility go hand-in-hand and day traders need an ample amount of volatility in order to lock in large gains.
In volatile markets, volume and price occasionally become disjointed, which can create opportunities for day trading.
Many indicators attempt to measure the relationship between volume and price, such as Volume Weighted Average Price (VWAP).
One of the lesser known volume-based indicators is the Ease of Movement Indicator, which attempts to compress volume and price volatility into a single number with clear buy and sell signals.
What is the Ease of Movement Indicator?
The Ease of Movement indicator was developed by Richard Arms, who wanted to find a way to simplify price and volume metrics in stocks.
The Ease of Movement indicator measures the ‘ease’ in which a stock price moves between different levels based on volume trends. An easy moving price is one that may continue in it’s trend for an extended period of time.
This indicator is a lower chart oscillator with a simple moving average and a value of 0 in the middle.
The moving average is usually 14 days, but traders can adjust the indicator to their own specifics (10 days is another common time frame). The key to this indicator is the 0 in the middle – that’s the signal to either go long or short based on the trends uncovered by the volume data.
Another key finding from the Ease of Movement indicator is how stocks moving on low volume can be singled out for trading.
For example, if a stock continues to appreciate in price despite low volume, it could signal a potential breakout.
How to Trade the Ease of Movement Indicator
The Ease of Movement indicator can provide some tell-tale signals for entry and exit points.
First, the indicator works best in volatile markets where uptrends or downtrends aren’t clearly defined.
If the stocks you’re looking at are in clear uptrends, using the Ease of Movement indicator could produce lackluster results. Choppy markets where long and short positions need to be frequently evaluated is the best scenario for the Ease of Movement indicator.
This indicator is best used for longer time frames, like a daily chart. Since it identifies trends based on volume averages, swing trading is preferred to day trading if you want to use this indicator.
When applying the this indicator to a stock, the signal you’re looking for is the moving average crossing over the 0 line on the middle of the chart.
This is your buy or sell signal. If the average crosses above the 0, it’s a signal to initiate a long position. If the average crosses below the 0, then you have a signal to short the stock.
Using these crossing points as entry and exit points, along with other technical trading signals like Exponential Moving Averages and volume data.
The signals sent by the Ease of Movement indicator tend to predate movements in the share price.
Easy moving prices often snowball, which means the Ease of Movement indicator is an excellent tool for predicting changes or continuations in short-term trends.
Example
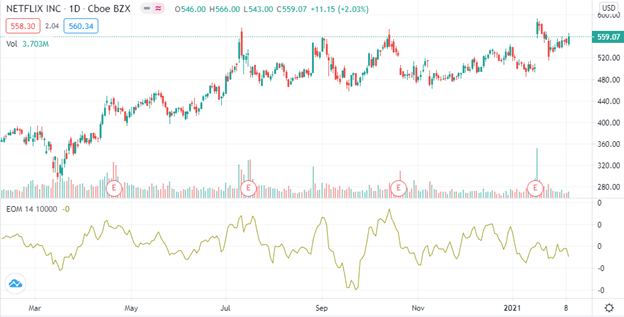
Here’s a chart from TradingView featuring one of the darling stocks from the early pandemic days: Netflix (NFLX).
But despite an early boost thanks to tailwinds from COVID-19 lockdowns, the stock began to trade in a choppy range starting in July 2020.
Choppy markets might be a problem for long-term investors, but for day and swing traders, it’s not an issue at all when applying indicators like Ease of Movement.
The first buy signal came at the end of March with the moving average passed above the 0 on the chart, which was shortly followed by a price increase from the $360 range to $440.
At the end of May, the Ease of Movement sent another signal as the moving average dropped under 0 – this time a sell signal. Once again, the signal was true as the price peeled back to $400.
The indicator really became useful once the stock began trading in a flat range in July, bouncing back and forth between lows near $480 and highs of $550.
In September alone, the Ease of Movement indicator issued three different signals (both buy and sell) and each time the trade was quickly justified as the trend prediction proved true.
Today, NFLX remains coiled in a tight range, so be sure to add the Ease of Movement indicator to your menu if you plan on trading it.
Bottom Line
Like all technical trading signals, the Ease of Movement indicator isn’t an automatic buy or sell order machine.
You’ll need to utilize it along with other similar charting tools like simple moving averages, volume indicators, and more common tools like RSI or MACD.
And remember that only certain market conditions will be conducive to trading signals from indicators like Ease of Movement.
No matter what type of trader you are, it’s always a good idea to add more technical hammers to your toolbox.
Trading isn’t a one-size-fits-all game and the market often forces us to trade in conditions outside our ideal preferences. If choppy markets are something you struggle with as a trader, consider a crash course on the Ease of Movement indicator to help with your success rate.